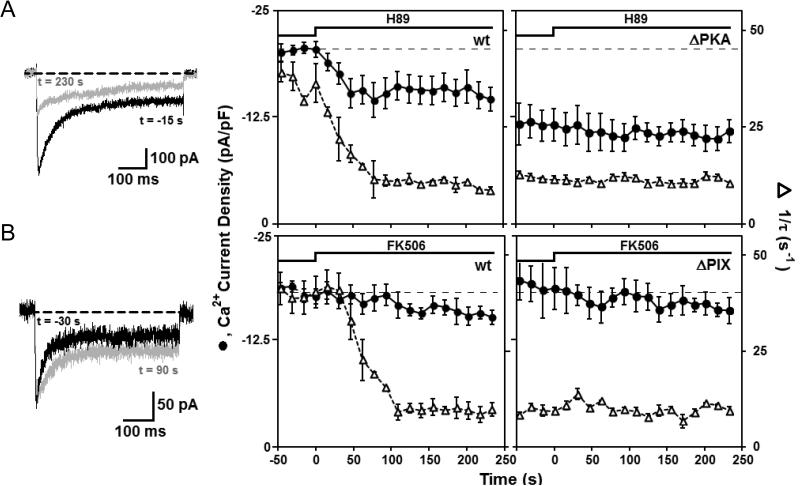
Figure 3. Time course of changes in current density and inactivation rate induced by inhibition of PKA or CaN.
(A) Response to fast perfusion of H89 (500 nM). (Left) Untransfected rat neurons. Inset, superimposed Ca2+ current records before (black) and during (gray) H89 application. (Right) Rat neurons expressing 79ΔPKA. (B) Response to fast application of FK506 (5 μM). (Left) Untransfected rat neurons. Inset, representative Ca2+ current records before (black) and during (gray) FK506 application. (Right) Rat neurons expressing 79ΔPIX. Error bars represent standard error of the mean.

