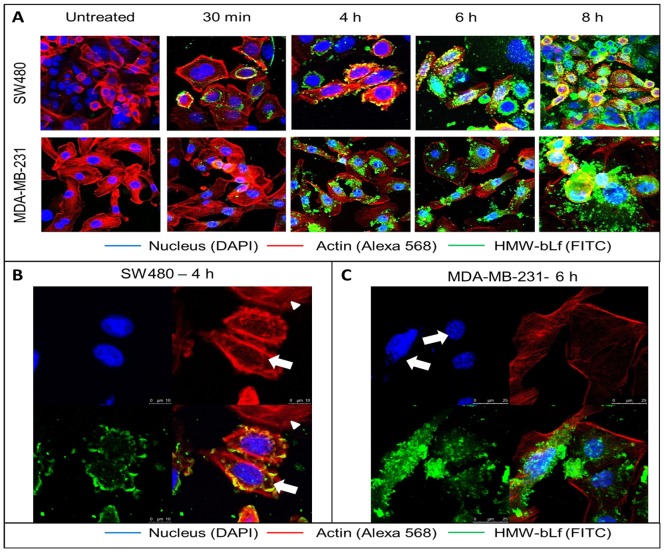
Figure 5. Cellular uptake of HMW-bLf.
A – Representative confocal microscopic images show HMW-bLf internalization in MDA-MB-231 and SW480 in a time dependent manner. The degradation of actin an indicator of apoptosis was observed after 6 h of treatment with HMW-bLf. The reduction in the intensity of the Alexa 568 signal indicates the degradation of the actin cytoskeleton. B and C are high magnification images HMW-bLf internalization in SW480 (B) and MDA-MB231(C) with separate panels showing nucleus, actin and HMW-bLf alone. Arrows in 4B points out to the cells that have taken up HMW-bLf showing perturbed actin structure, and arrowhead points out to the cell with intact actin structure and is without HMW-bLf uptake in 4 h (SW480). Arrows in 4C point out to the beginning of nuclear degradation at 6 h (MDA-MB-231).

