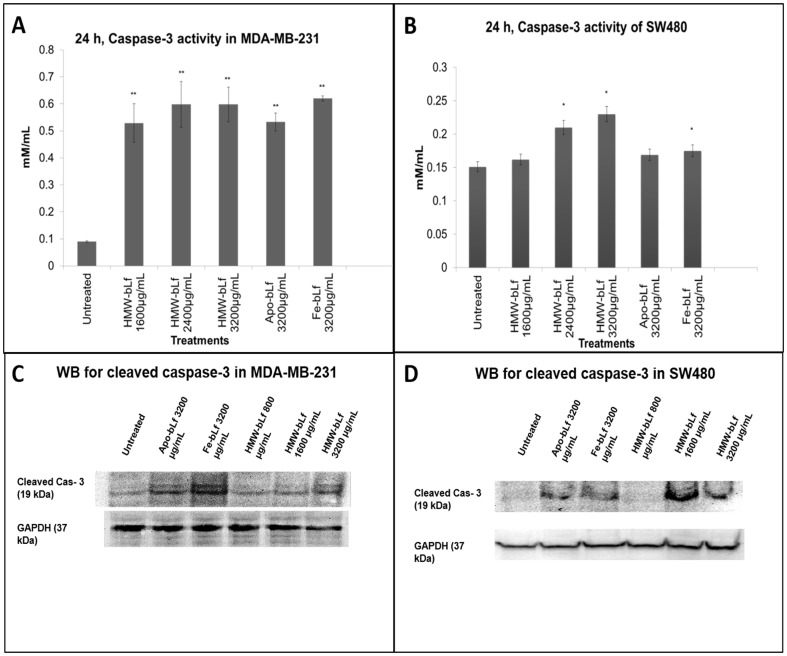
Figure 6. Caspase-3 activation.
A and B represent the increased caspase-3 activity measurements upon treatment with HMW-bLf in MDA-MB-231 and SW480 cells, respectively. (* P<0.05 and ** P<0.01). Panels C and D are the respective Western blots showing an increase in cleaved caspase-3 expression upon treatments in MDA-MB-231 and SW480 cells.

