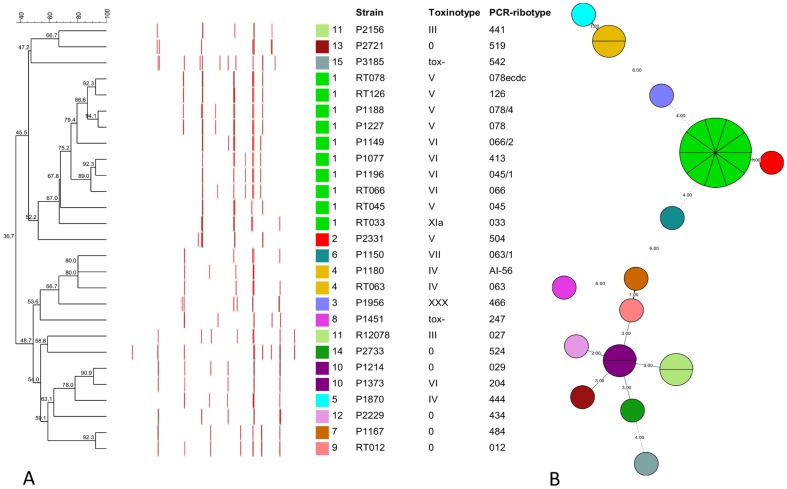
Figure 1. Clustering of C. difficile PCR-ribotypes.
(A) Clustering of PRC-ribotypes based on fingerprinting profiles generated by capillary gel electrophoresis-based PCR-ribotyping. Dendrogram is color coded according to MLST type. The exact lengths of the bands, representing the 16S-23S rRNA intergenic spacer regions are given in Table S1. (B) Minimum spanning tree of MLST results showing relatedness of PCR-ribotypes. Each circle represents one sequence type (ST) and is subdivided into sectors corresponding to the number of PCR-ribotypes represented with this ST. The numbers between circles represent number of differing loci between the STs.

