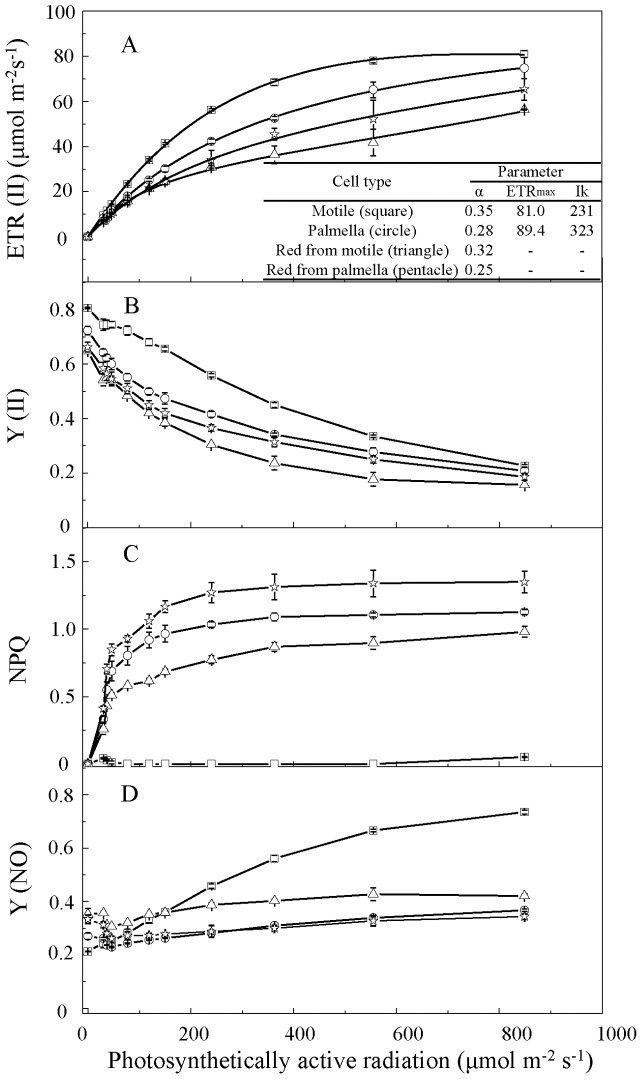
Figure 2. Light intensity response curves in different types of cells.
(A) Photosynthetic electron transport rate in photosystem II [ETR(II)]; (B) quantum yield in photosystem II [Y(II)]; (C) nonphotochemical quenching (NPQ); (D) energy dissipated by a nonregulated mechanism in photosystem II [Y(NO)]. Values represent the mean ± S.D. (n = 3). Motile cells: square; palmella cells: circle; red cells induced from motile cells: triangle; red cells induced from palmella cells: pentacle.

