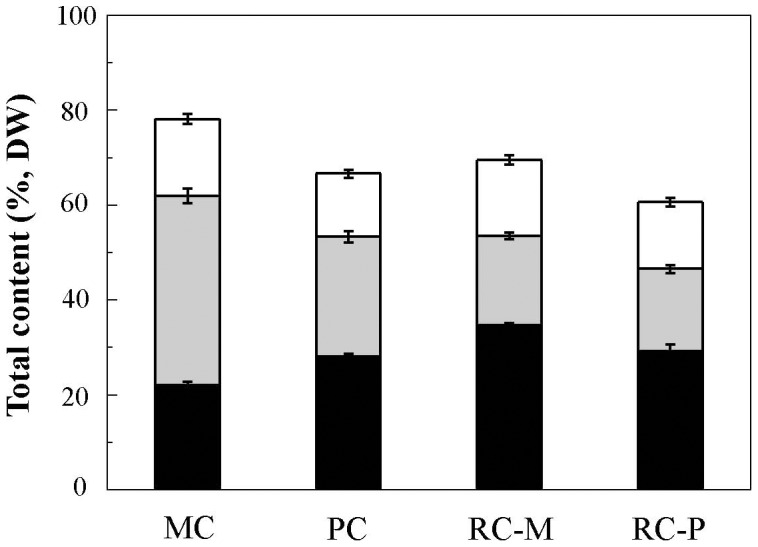
Figure 4. Analyses of total carbohydrate, protein, and glycerolipids in different H. pluvialis cell types.

Values represent the mean ± S.D. (n = 6). MC: motile cells; PC: palmella cells; RC-M: red cells induced from motile cells; RC-P: red cells induced from palmella cells. Total glycerolipids: white rectangle; total protein: light grey rectangle; total carbohydrate: black rectangle.
