
Figure 1.
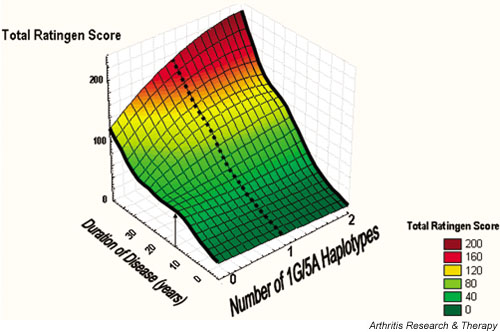
Three-dimensional surface plot showing the main effects for a multiple regression of total Ratingen score versus duration of disease and number of 1G(MMP1)-5A(MMP3) haplotypes. The plot was created by distance-weighted least-squares interpolation. Black lines represent patients with either none or two 1G-5A haplotypes. The broken line, representing patients with one haplotype, is an approximation because it was not possible to determine exactly the number of patients with one 1G-5A haplotype. The arrow indicates the maximum increase in the Ratingen score after 15 years of rheumatoid arthritis in patients with no 1G-5A haplotype (see the text for further explanations). MMP, matrix metalloproteinase.