

Abstract
BACKGROUND
The role of proximal tubule (PT) angiotensinogen (AGT) in modulating blood pressure has previously been examined using mice expressing PT human AGT and human renin, or rat AGT. These animals are hypertensive; however, the question remains whether alterations in mouse PT AGT alone affects arterial pressure.
METHODS
Mouse AGT cDNA was knocked-in to the endogenous kidney androgen protein (KAP) gene using an internal ribosomal entry site (IRES)-based strategy.
RESULTS
The KAP-mAGT animals showed kidney-specific KAP-AGT mRNA expression; renal in situ hybridization detected KAP-AGT mRNA only in PT. Urinary AGT was markedly increased in KAP-mAGT mice. On a high Na diet, radiotelemetric arterial pressure showed a systolic pressure elevation; no significant difference in arterial pressure was observed on a normal diet. Plasma renin concentration (PRC) was reduced in KAP-mAGT animals given a high Na diet, but was not different between mouse lines during normal Na intake. Plasma AGT concentration was not altered by overexpression of PT mouse AGT.
CONCLUSIONS
In summary, PT overexpression of mouse AGT leads to salt-sensitive hypertension without recruitment of the systemic renin–angiotensin system.
Keywords: angiotensinogen, blood pressure, hypertension, kidney, proximal tubule, renin, transgene
Angiotensinogen (AGT) is important in the control of arterial pressure and renal Na excretion. There is significant linkage and allelic association between hypertension and the AGT gene.1 Smithies and colleagues have demonstrated a close correlation between the number of AGT gene copies and arterial pressure in mice.2,3 Global overexpression of human AGT and human renin, but neither alone, causes hypertension in mice.4
While hepatic-derived AGT is of fundamental importance in circulatory homeostasis, AGT of renal origin also is of significance. AGT is found in the urine; however, it does not derive from the circulation. Systemically administered human AGT does not appear in the urine of rats.5 This is due to the relatively low glomerular filtration (the molecular weight of AGT is 61–65 kDa). In addition, any filtered AGT is likely endocytosed in the early proximal tubule (PT) by a megalin-dependent mechanism.6
The primary source of AGT in the kidney is the PT. A number of studies, both in vitro and in vivo, have demonstrated PT AGT synthesis in mouse and rat.6–11 AGT is released into the tubule lumen and can reach all distal nephron segments, including appearing in the urine.12,13 The potential for PT-derived AGT to modulate arterial pressure has been explored in a series of elegant experiments. Overexpression of human AGT selectively in the PT under control of the kidney androgen protein (KAP) promoter causes no apparent effects in mice, most likely due to the inability of rodent renin to cleave human AGT.14 However, mice containing transgenes conferring PT-specific human AGT expression and global human renin expression are hypertensive. 14 Notably, KAP-human AGT transgene expression is induced by androgens, but remains PT-specific15; hence, most studies were done in male animals. This group also demonstrated that mice with KAP promoter-driven human AGT and human renin expression were also hypertensive.16 Finally, overexpression of rat AGT in the mouse PT causes hypertension and proteinuria, albeit testosterone must be given to induce the KAP promoter even in males.17
A key remaining issue is whether PT-derived AGT can modulate arterial pressure under conditions in which renin is not also modified. In the human AGT and human renin studies, renin was effectively clamped at a high level, raising the question as to what role AGT itself played. Similar considerations can be raised for the rat AGT overexpression studies since the catalytic efficiency of mouse renin on rat AGT may be up to 64-fold greater than the homo-specific reaction.18,19 Thus, the possibility remains that net mouse overreactivity, equivalent to renin clamping by overexpression, contributed to the phenotype in this model. Consequently, the current studies, in which mouse AGT was selectively expressed in the PT, were undertaken in order to examine the effect of overexpression of AGT alone with normal renin responses in place.
METHODS
Animal care
All animal studies were conducted with the approval of the University of Utah Animal Care and Use Committee in accordance with the National Institutes of Health Guide for the Care and Use of Laboratory Animals.
Generation of gene targeting vector
The cDNA of mouse AGT, preceded by an internal ribosome entry site (IRES) sequence and followed by Cre recombinase and a neomycin resistance (NeoR) cassette (flanked by flp-recombinase recognition target motifs), was cloned into the KAP gene genomic fragment between Spe I (86115225) and Cla I (86109505) at the BspM I site (86112997) (all numbers referenced to ref|NT_039353.7|Mm6_39393_37); this is located in the 3′-untranslated region of the KAP gene (Figure 1a). The KAP flanking fragments were necessary for targeting by homologous recombination. Following validation of the vector by sequencing, linearized and trimmed DNA was provided to Universities of Utah and Michigan core transgenic facilities for electroporation into mouse embryonic stem cells.
Figure 1.
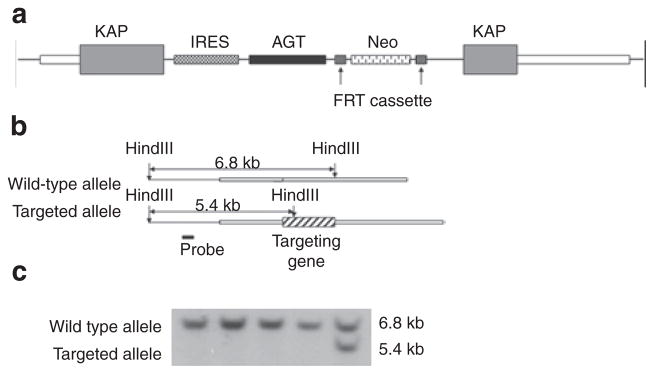
KAP-AGT transgene. (a) Targeting vector map. (b) Southern blotting strategy. (c) Representative result of Southern blotting screening. AGT, angiotensinogen cDNA; FRT, flp- recombinase recognition target; IRES, internal ribosome entry site; KAP, kidney androgen regulated protein genomic DNA fragment; Neo, neomycin resistance cassette (PGK-neo-pA).
Generation of targeted mice
Linearized DNA was introduced into embryonic stem cells of 129S6 origin by electroporation. Successful targeting events were identified by Southern blotting (Figure 1b, c) with a probe fragment located 5′ upstream of the 5′ homolog arm; the targeted allele was characterized by the presence of a 5.4-kb HindIII restriction fragment. Identified colonies with at least 80% of embryonic stem cells possessing 40 chromosomes were injected into C57BL/6J blastocysts. Chimeras with ~75% or more agouti coat color were backcrossed to C57BL/6J mates. The progeny from these crosses was genotyped by either Southern blotting or PCR to determine whether germline transmission of the transgene had occurred. All mice were subsequently bred on a C57BL/6J background for at least six generations.
Removal of NeoR cassette
To remove the NeoR cassette, targeted animals were crossed with flp-deleter animals which express flp recombinase. Removal of the NeoR cassette was verified by PCR genotyping. Such removal is usually recommended to avoid potential toxic effects or other interferences that may be induced by NeoR expression.
Verification of PT-specific expression
Total RNA was extracted from tissues including adipose, adrenal gland, intestine, lung, muscle, heart, brain, kidney, and liver of targeted and wild-type animals. Reverse transcription PCR (RT-PCR) using primers which only amplified the fusion gene was performed to verify if the targeted gene was selectively expressed in the kidneys. To further study if the targeted gene was specifically expressed in the PT, an in situ probe was generated by RT-PCR of total RNA from mouse kidney (using the RNeasy system (Qiagen, Valencia, CA)). In a second PCR step, modified primers, containing the original sequence and additional T7 polymerase binding sites, were used to generate cDNA templates with 5′ or 3′ T7 RNA polymerase binding sites. Specifically, 5′-TGTGGCCATATTATCATCGTG-3′ and 5′-CTAATACGA CTCACTATAGGGCGCTAACGTTACTGGCCGAAGC-3′ were used to generate sense template and 5′-CTAACGTTAC TGGCCGAAGC-3′ and 5′-CTAATACGACTCACTATAGGG CGTGTGGCCATATTATCATCGTG-3′ were used to generate antisense template. Digoxigenin-labeled sense and antisense probes were generated using 1 μg purified cDNA template, T7 RNA polymerase, and the digoxigenin RNA labeling kit (Roche Diagnostics, Indianapolis, IN). Probes were diluted in ULTRAhybTM hybridization buffer (Ambion; Applied Biosystems, Carlsbad, CA) and used for hybridization. Tissue was removed and fixed with 4% paraformaldehyde for 2 h at room temperature and treated with 5%, 15%, and 30% sucrose in phosphate-buffered saline for 30 min each and then embedded with optimal cutting temperature media. The embedded tissue was frozen and cut 20 μm thick on a cryostat. The sections were hybridized with probes described above following standard protocols. Following washes, digoxigenin was detected using an alkaline phosphatase-conjugated antibody (Dako, Carpenteria, CA). The sections were stained with nitroblue tetrazolium/ 5-bromo- 4-chloro-3-indoly-phosphate substrate.
Blood pressure monitoring
Blood pressure of the mice was monitored by telemetry (TA11-PAC10; Data Sciences International, St. Paul, MN).20 The mice were allowed to recover for at least 1 week after surgery. Blood pressure, heart rate, and activity were monitored for 10 s every half an hour. Mice were initially fed a normal Na (0.3%) diet for 5 days, followed by a high Na (3.15% Na) diet for 5 days.
Infusion study
After blood pressure monitoring, mice were anesthetized with isoflurane and body temperature kept at 38 °C using a heating pad. The left external jugular vein was cannulated with PE-10 tubing for the infusion of fluids. An incision was made on the low abdomen and the bladder was exposed. Two milliliters of physiological saline solution containing 135 mmol/l NaCl, 5.0 mmol/l KCl, 2.0 mmol/l MgCl2, 1.0 mmol/l CaCl2, 10 mmol/l HEPES, and 4.5% albumin was infused as a bolus. Urine was collected by puncture of the bladder using a syringe at time 0, 30, 45, and 60 min counting from the beginning of the infusion. The volume of the urine samples was measured and the urine stored at −80 °C until assay.
Blood and urine assays
Blood was collected by tail snip or by cardiac puncture at the end of the study and transferred into a polypropylene tube containing EDTA at 0 °C. Plasma was separated and stored at −80 °C until assay. Uncleaved AGT was assayed as the amount of angiotensin 1 (A I) generated in an exhaustive cleavage reaction after addition of highly purified renin as described previously.11 Urinary angiotensin II (Ang II) and total AGT were determined by commercially available immunoassays (Bachem, San Carlos, CA and IBL America, Minneapolis, MN, respectively). Plasma renin activity was measured as the amount of A I generated after incubation. Plasma renin activity was expressed as the amount of A I spontaneously generated per hour per microliter of plasma. Plasma renin concentration (PRC) was measured as the amount of A I generated after incubation with excess AGT. PRC was expressed as the amount of A I generated per hour per microliter of plasma.
For urine studies, mice were placed into metabolic cages on the fifth day of the normal or high Na diet, weighed, and urine collected for 24 h. Urine volume was measured, Na and K were determined on an EasyVet Analyzer (Medica, Bedford, MA), creatinine was measured using the Quantichrom kit (Bioassay Systems, Hayward, CA), and AGT (uncleaved and total) and Ang II determined as described above.
Statistical analysis
Except for blood pressure, all results are expressed as mean ± s.e.m. Student’s t-test was used to compare differences between groups. Analysis of repeated measurement of blood pressure was carried out using SAS software as described previously.20 Blood pressure was analyzed for daytime and nighttime separately to reduce the effects caused by the heterogeneity in activity during the two periods. A previous study in our laboratory has shown a significant change in variances in the transitions from active to inactive states.20 To reduce the variance and simplify the model, the measurements during the transition of the two activity states were excluded from the analysis. Consequently, daytime was defined as 10:00 am to 5:00 pm and nighttime was defined as 8:00 pm to 5:00 am. Genotype effects and least squares means were estimated by applying the model described above using the SAS package.
RESULTS
Verification of PT-specific expression of KA P- IRE S-mAGT
A multitissue RNA panel was prepared from targeted and untargeted offspring and screened by RT-PCR using primers that only amplify the fusion transgene to determine whether the target transcript was expressed only in kidney of targeted animals. The targeted gene was detected only in kidney (Figure 2a). To further verify that the targeted gene was only expressed in the PT, as expected from the KAP gene expression pattern, in situ hybridization was performed using kidneys of a targeted animal. Staining was exclusively observed in the PT (Figure 2b). Thus, renal PT-specific expression of the transgene was confirmed.
Figure 2.

Verification of proximal tubule-specific expression of the targeting gene. (a) Representative (of N = 4) results of RT-PCR. (b) In situ hybridization. I: wild type, II–IV: Targeted. AGT, angiotensinogen; KAP, kidney androgen protein; RT-PCR, reverse transcription PCR.
Assessment of mAGT protein expression in targeted and con trol animals
Even though we demonstrated significant overexpression of the KAP-IRES-mAGT transcript, ultimately, the impact of gene targeting on AGT expression depends on the rate of ribosomal usage of the IRES motif, with ensuing translation and production of AGT protein. Given that total urinary AGT increases with chronic Na loading, and that this likely represents uncleaved AGT due to net increase in tubular flow (Lantelme, 2002), we evaluated urinary excretion of uncleaved AGT upon Na loading in targeted and control mice. As shown in Figure 3, urinary uncleaved AGT was present at 6–10 nmol/l concentrations (0-min time point) in targeted animals. In wild-type animals at baseline, by contrast, urinary uncleaved AGT was not detected. Upon applying the acute Na load, urinary uncleaved AGT concentrations increased in control mice to 2.5 nmol/l after 30 min (P < 0.05 vs. time 0). Thereafter, urinary AGT concentration markedly decreased. In targeted animals, urinary AGT concentration remains high, before, during and post-infusion. While urinary AGT concentrations in targeted animals were not clearly affected by acute saline infusion, urinary AGT excretion rate peaked at 45 min, whereas control animals AGT excretion rate peaked at 30 min.
Figure 3.

Urinary (a) uncleaved AGT concentration and (b) excretion rate in targeted and control animals during acute Na loading by infusion. The infusion started at time 0 and finished at time 30 min. Urine samples were collected at time 0, 30, 45, and 60 min. N = 4 each data point. AGT, angiotensinogen.
Urinary cleaved and total AGT were measured in conscious animals after 5 days on a normal or high Na diet (Table 1). Uncleaved and total urine AGT were markedly higher in KAP-AGT mice compared to controls on a normal or high Na diet. Uncleaved and total urine AGT rose in control mice with Na loading, while no change was seen in urine AGT in KAP-AGT mice with Na loading, albeit baseline urinary AGT was extremely elevated in the targeted mice.
Table 1.
Urine and plasma renin/angiotensin system in control and KA P-AGT mice after 5 days on a normal (0.3%) or high (3.15%) Na diet (N = 5–7)
| Control | KAP-AGT | |
|---|---|---|
| Normal Na | ||
| Plasma AGT (nmol/l) | 17.1 ± 2.3 | 17.7 ± 3.8 |
| PRC (pg A I/μl/h) | 48.9 ± 7.1 | 43.5 ± 3.9 |
| PRA (pg A I/μl/h) | 8.1 ± 0.8 | 7.6 ± 1.3 |
| Uncleaved urine AGT (ng/day) | 0.009 ± 0.03 | 0.060 ± 0.019* |
| Total urine AGT (ng/day) | 1.78 ± 0.34 | 199 ± 95* |
| Urine Ang II (ng/day) | 0.27 ± 0.08 | 0.59 ± 0.17* |
| High Na | ||
| Plasma AGT (nmol/l) | NM | NM |
| PRC (pg A I/μl/h) | 19.0 ± 2.8 | 15.2 ± 2.4* |
| PRA (pg A I/μl/h) | ND | ND |
| Uncleaved urine AGT (ng/day) | 0.024 ± 0.06 | 0.098 ± 0.027* |
| Total urine AGT (ng/day) | 4.24 ± 0.82 | 184 ± 102* |
| Urine Ang II (ng/day) | 0.15 ± 0.05 | 0.41 ± 0.11* |
A I, angiotensin I; AGT, angiotensinogen; Ang II, angiotensin II; KAP, kidney androgen protein; ND, not detectable; NM, not measured; PRA, plasma renin activity; PRC, plasma renin concentration.
P < 0.05 vs. control.
Urinary Ang II excretion was increased in KAP-AGT mice compared to controls on a normal or high Na diet (Table 1). Ang II excretion tended to be suppressed in both groups of mice with high Na loading.
Assessment of blood pressure and pulse
Blood pressure of targeted mice as well as littermate controls was monitored by telemetry. Systolic blood pressure tended to be higher in targeted animals on a normal Na intake, but did not achieve statistical significance (Figure 4). However, systolic blood pressure was significantly elevated during daytime (9.2 mm Hg increase) and nighttime systolic blood pressure (10.2 mm Hg increase) in targeted mice compared to littermate controls when fed a high Na diet. No significant differences in diastolic blood pressure were found under both diets and in both animal lines comparing to their littermates (Figure 4). Pulse was not significantly different between targeted and control mice on either a normal (551 ± 23 in KAP-AGT and 568 ± 31 in controls, N = 7) or high (542 ± 10 in KAP-AGT and 558 ± 29 in controls, N = 7) Na diet.
Figure 4.

SBP and DBP of targeted animals and their littermates (n = 6 each group). Shown are the least squares means estimated by mixed models. DBP, diastolic blood pressure; SBP, systolic blood pressure.
Systemic renin–angiotensin system
Because systolic blood pressure was higher in the targeted animals than their littermate controls under a high Na diet, we tested whether the systemic renin–angiotensin system was involved (Table 1). There was no significant difference in plasma AGT, PRC, or plasma renin activity in mice fed a normal Na diet. However, when the mice were fed a high Na diet, PRC was about 20% (P < 0.05) lower in the targeted animals than in the controls. Plasma renin activity was undetectable in mice on a high Na diet.
Renal function parameters and body weight
There was no significant difference in body weight between KAP-AGT and control animals (24.7 ± 0.8 g for KAP-AGT and 25.2 ± 0.9 g for controls, N = 7). Urine volume, Na and K excretion, and creatinine excretion were not different between KAP-AGT and control mice on a normal or high Na diet (Table 2).
Table 2.
Urine volume, electrolyte, and creatinine excretion in control and KA P-AGT mice after 5 days on a normal (0.3%) or high (3.15%) Na diet (N = 6–7)
| Control | KAP-AGT | |
|---|---|---|
| Normal Na | ||
| Urine volume (ml/day) | 0.87 ± 0.13 | 1.04 ± 0.18 |
| Urine Na+ excretion (μEq/day) | 97 ± 21 | 104 ± 23 |
| Urine K+ excretion (μEq/day) | 205 ± 28 | 232 ± 27 |
| Urine creatinine excretion (mg/day) | 0.54 ± 0.03 | 0.58 ± 0.07 |
| High Na | ||
| Urine volume (ml/day) | 2.84 ± 0.65 | 3.06 ± 0.79 |
| Urine Na+ excretion (μEq/day) | 1193 ± 333 | 1441 ± 482 |
| Urine K+ excretion (μEq/day) | 276 ± 53 | 287 ± 84 |
| Urine creatinine excretion (mg/day) | 0.62 ± 0.09 | 0.64 ± 0.10 |
AGT, angiotensinogen; KAP, kidney androgen protein.
CONCLUSION
The goal of the current study was to determine whether overexpression of mouse AGT in the PT causes hypertension. Such hypertension was noted in KAP-AGT mice fed a high salt diet. Notably, PRC was reduced under these circumstances, suggesting that not only does the systemic renin–angiotensin system not contribute to the elevated arterial pressure, but that it is also down regulated as negative feedback for the elevated arterial pressure, presumably through a volume-dependent mechanism. Furthermore, no changes in systemic AGT levels were detected, consistent with previous findings that PT-derived AGT appears in the urine, but not in plasma.21 Finally, the hypertension occurred in the absence of overexpression of renin, i.e., as was done in the human renin/human AGT overexpression studies14,15, or artificially enhanced renin activity due to mouse renin/rat AGT interaction.17 These studies did not, however, address whether endogenous PT AGT (not overexpressed AGT) does, in fact, contribute under certain circumstances to hypertension. Such studies are somewhat problematic, but could partially be addressed by PT-specific knockout of AGT in the setting of high salt intake and/or other maneuvers to modify arterial pressure.
PT-derived AGT could potentially generate Ang II locally through cleavage by filtered renin22 and conversion to Ang II by PT angiotensin-converting enzyme.23 Indeed, we observed an increase in urinary Ang II excretion in KAP-AGT mice. Notably, urinary Ang II tended to be reduced by high Na loading, suggesting that endogenous renal renin may have been reduced with high Na intake. Such endogenous renin could derive, at least in part, from the distal nephron. The connecting segment and collecting duct synthesize renin11,24,25 that can be secreted into the tubular lumen.26 Angiotensin-converting enzyme is present throughout the nephron.23 Such intraluminal generation of Ang II could then potentially stimulate collecting duct Na reabsorption. Luminal Ang II stimulated Na transport in isolated perfused rabbit and mouse collecting ducts through a benzamil-sensitive pathway that was prevented by AT1 antagonism.27,28 Notably, the stimulatory effect of Ang II on ENaC activity was evident at Ang II concentrations as low as 1 pmol/l, suggesting that very low concentrations of luminal Ang II regulate collecting duct Na reabsorption. Taken together, the above considerations raise the possibility that PT-derived AGT might regulate arterial pressure through modification of proximal and distal nephron Na transport. Further studies evaluating the Na transporters involved in mediated PT AGT-induced hypertension are warranted.
The current study examined only male mice in order to avoid potentially confounding effects of androgen administration to females (the KAP-AGT transgene in females must be induced by exogenously administered androgens). It is necessary, however, to acknowledge that gender differences may well exist with respect to PT AGT. There is a strong correlation between urinary AGT and essential hypertension only among females with low-renin/low-aldosterone hypertension.29 Okamoto and colleagues have shown a fourfold greater level of urinary AGT in male compared to female rats.30 Ellison and colleagues found that androgens markedly affect PT AGT mRNA in WKY rats,31 while Quan and colleagues showed that testosterone administration increased PT AGT mRNA levels associated with increased PT fluid reabsorption and increased brush border NHE3 expression.32 Thus, studies are ultimately needed to determine the role of PT AGT specifically in females.
In summary, our study demonstrates that overexpression of AGT in the PT, in the setting of normal renin compensatory responsiveness, causes hypertension. The hypertensive effect, while not specifically studied, is presumably due to enhanced renal Na retention. Thus, endogenous PT AGT may have the capability, even in the presence of low circulating renin concentrations, to produce Ang II in sufficient amounts to alter renal function. Key questions that remain are (i) whether proximal AGT is produced in sufficient amounts under physiologic or pathophysiologic conditions to alter renal function; (ii) more complete understanding of how PT AGT production is regulated; (iii) whether PT-derived AGT can modify distal nephron function through an interaction with renin produced by the connecting segment and collecting duct; and (iv) whether alterations in PT AGT production contribute to individual susceptibility to the development of hypertension.
Acknowledgments
This research was supported by NHLBI R01 HL093457 grant (to D.E.K.).
Footnotes
Disclosure: The authors declared no conflict of interest.
References
- 1.Jeunemaitre X, Soubrier F, Kotelevtsev YV, Lifton RP, Williams CS, Charru A, Hunt SC, Hopkins PN, Williams RR, Lalouel JM. Molecular basis of human hypertension: role of angiotensinogen. Cell. 1992;71:169–180. doi: 10.1016/0092-8674(92)90275-h. [DOI] [PubMed] [Google Scholar]
- 2.Kim HS, Krege JH, Kluckman KD, Hagaman JR, Hodgin JB, Best CF, Jennette JC, Coffman TM, Maeda N, Smithies O. Genetic control of blood pressure and the angiotensinogen locus. Proc Natl Acad Sci USA. 1995;92:2735–2739. doi: 10.1073/pnas.92.7.2735. [DOI] [PMC free article] [PubMed] [Google Scholar]
- 3.Smithies O, Kim HS. Targeted gene duplication and disruption for analyzing quantitative genetic traits in mice. Proc Natl Acad Sci USA. 1994;91:3612–3615. doi: 10.1073/pnas.91.9.3612. [DOI] [PMC free article] [PubMed] [Google Scholar]
- 4.Merrill DC, Thompson MW, Carney CL, Granwehr BP, Schlager G, Robillard JE, Sigmund CD. Chronic hypertension and altered baroreflex responses in transgenic mice containing the human renin and human angiotensinogen genes. J Clin Invest. 1996;97:1047–1055. doi: 10.1172/JCI118497. [DOI] [PMC free article] [PubMed] [Google Scholar]
- 5.Kobori H, Nishiyama A, Harrison-Bernard LM, Navar LG. Urinary angiotensinogen as an indicator of intrarenal Angiotensin status in hypertension. Hypertension. 2003;41:42–49. doi: 10.1161/01.hyp.0000050102.90932.cf. [DOI] [PMC free article] [PubMed] [Google Scholar]
- 6.Pohl M, Kaminski H, Castrop H, Bader M, Himmerkus N, Bleich M, Bachmann S, Theilig F. Intrarenal renin angiotensin system revisited: role of megalin-dependent endocytosis along the proximal nephron. J Biol Chem. 2010;285:41935–41946. doi: 10.1074/jbc.M110.150284. [DOI] [PMC free article] [PubMed] [Google Scholar]
- 7.Darby IA, Congiu M, Fernley RT, Sernia C, Coghlan JP. Cellular and ultrastructural location of angiotensinogen in rat and sheep kidney. Kidney Int. 1994;46:1557– 1560. doi: 10.1038/ki.1994.445. [DOI] [PubMed] [Google Scholar]
- 8.Ingelfinger JR, Jung F, Diamant D, Haveran L, Lee E, Brem A, Tang SS. Rat proximal tubule cell line transformed with origin-defective SV40 DNA: autocrine ANG II feedback. Am J Physiol. 1999;276:F218–F227. doi: 10.1152/ajprenal.1999.276.2.F218. [DOI] [PubMed] [Google Scholar]
- 9.Ingelfinger JR, Zuo WM, Fon EA, Ellison KE, Dzau VJ. In situ hybridization evidence for angiotensinogen messenger RNA in the rat proximal tubule. An hypothesis for the intrarenal renin angiotensin system. J Clin Invest. 1990;85:417–423. doi: 10.1172/JCI114454. [DOI] [PMC free article] [PubMed] [Google Scholar]
- 10.Niimura F, Okubo S, Fogo A, Ichikawa I. Temporal and spatial expression pattern of the angiotensinogen gene in mice and rats. Am J Physiol. 1997;272:R142–R147. doi: 10.1152/ajpregu.1997.272.1.R142. [DOI] [PubMed] [Google Scholar]
- 11.Rohrwasser A, Morgan T, Dillon HF, Zhao L, Callaway CW, Hillas E, Zhang S, Cheng T, Inagami T, Ward K, Terreros DA, Lalouel JM. Elements of a paracrine tubular renin-angiotensin system along the entire nephron. Hypertension. 1999;34:1265–1274. doi: 10.1161/01.hyp.34.6.1265. [DOI] [PubMed] [Google Scholar]
- 12.Lantelme P, Rohrwasser A, Gociman B, Hillas E, Cheng T, Petty G, Thomas J, Xiao S, Ishigami T, Herrmann T, Terreros DA, Ward K, Lalouel JM. Effects of dietary sodium and genetic background on angiotensinogen and Renin in mouse. Hypertension. 2002;39:1007–1014. doi: 10.1161/01.hyp.0000016177.20565.a0. [DOI] [PubMed] [Google Scholar]
- 13.Navar LG, Harrison-Bernard LM, Wang CT, Cervenka L, Mitchell KD. Concentrations and actions of intraluminal angiotensin II. J Am Soc Nephrol. 1999;10(Suppl 11):S189–S195. [PubMed] [Google Scholar]
- 14.Davisson RL, Ding Y, Stec DE, Catterall JF, Sigmund CD. Novel mechanism of hypertension revealed by cell-specific targeting of human angiotensinogen in transgenic mice. Physiol Genomics. 1999;1:3–9. doi: 10.1152/physiolgenomics.1999.1.1.3. [DOI] [PubMed] [Google Scholar]
- 15.Ding Y, Sigmund CD. Androgen-dependent regulation of human angiotensinogen expression in KAP-hAGT transgenic mice. Am J Physiol Renal Physiol. 2001;280:F54–F60. doi: 10.1152/ajprenal.2001.280.1.F54. [DOI] [PubMed] [Google Scholar]
- 16.Lavoie JL, Lake-Bruse KD, Sigmund CD. Increased blood pressure in transgenic mice expressing both human renin and angiotensinogen in the renal proximal tubule. Am J Physiol Renal Physiol. 2004;286:F965–F971. doi: 10.1152/ajprenal.00402.2003. [DOI] [PubMed] [Google Scholar]
- 17.Sachetelli S, Liu Q, Zhang SL, Liu F, Hsieh TJ, Brezniceanu ML, Guo DF, Filep JG, Ingelfinger JR, Sigmund CD, Hamet P, Chan JS. RAS blockade decreases blood pressure and proteinuria in transgenic mice overexpressing rat angiotensinogen gene in the kidney. Kidney Int. 2006;69:1016–1023. doi: 10.1038/sj.ki.5000210. [DOI] [PubMed] [Google Scholar]
- 18.Poulsen K. Kinetics of the renin system. The basis for determination of the different components of the system. Scand J Clin Lab Invest Suppl. 1973;132:3–86. [PubMed] [Google Scholar]
- 19.Poulsen K, Jacobsen J. Is angiotensinogen a renin inhibitor and not the substrate for renin? J Hypertens. 1986;4:65–69. doi: 10.1097/00004872-198602000-00011. [DOI] [PubMed] [Google Scholar]
- 20.Gociman B, Rohrwasser A, Hillas E, Cheng T, Hunter G, Hunter J, Lott P, Monson S, Ying J, Lalouel JM. Response to genetic manipulations of liver angiotensinogen in the physiological range. J Hum Genet. 2008;53:775–788. doi: 10.1007/s10038-008-0311-1. [DOI] [PubMed] [Google Scholar]
- 21.Ding Y, Davisson RL, Hardy DO, Zhu LJ, Merrill DC, Catterall JF, Sigmund CD. The kidney androgen-regulated protein promoter confers renal proximal tubule cell-specific and highly androgen-responsive expression on the human angiotensinogen gene in transgenic mice. J Biol Chem. 1997;272:28142–28148. doi: 10.1074/jbc.272.44.28142. [DOI] [PubMed] [Google Scholar]
- 22.Kobori H, Nangaku M, Navar LG, Nishiyama A. The intrarenal renin-angiotensin system: from physiology to the pathobiology of hypertension and kidney disease. Pharmacol Rev. 2007;59:251–287. doi: 10.1124/pr.59.3.3. [DOI] [PubMed] [Google Scholar]
- 23.Casarini DE, Boim MA, Stella RC, Krieger-Azzolini MH, Krieger JE, Schor N. Angiotensin I-converting enzyme activity in tubular fluid along the rat nephron. Am J Physiol. 1997;272:F405–F409. doi: 10.1152/ajprenal.1997.272.3.F405. [DOI] [PubMed] [Google Scholar]
- 24.Prieto-Carrasquero MC, Harrison-Bernard LM, Kobori H, Ozawa Y, Hering-Smith KS, Hamm LL, Navar LG. Enhancement of collecting duct renin in angiotensin II-dependent hypertensive rats. Hypertension. 2004;44:223–229. doi: 10.1161/01.HYP.0000135678.20725.54. [DOI] [PMC free article] [PubMed] [Google Scholar]
- 25.Prieto-Carrasquero MC, Kobori H, Ozawa Y, Gutiérrez A, Seth D, Navar LG. AT1 receptor-mediated enhancement of collecting duct renin in angiotensin II-dependent hypertensive rats. Am J Physiol Renal Physiol. 2005;289:F632–F637. doi: 10.1152/ajprenal.00462.2004. [DOI] [PMC free article] [PubMed] [Google Scholar]
- 26.Bailie MD, Donoso VS, Porter TM. Urinary excretion of renin in the dog: effect of changes in plasma renin. J Pharmacol Exp Ther. 1983;225:366–371. [PubMed] [Google Scholar]
- 27.Komlosi P, Fuson AL, Fintha A, Peti-Peterdi J, Rosivall L, Warnock DG, Bell PD. Angiotensin I conversion to angiotensin II stimulates cortical collecting duct sodium transport. Hypertension. 2003;42:195–199. doi: 10.1161/01.HYP.0000081221.36703.01. [DOI] [PubMed] [Google Scholar]
- 28.Peti-Peterdi J, Warnock DG, Bell PD. Angiotensin II directly stimulates ENaC activity in the cortical collecting duct via AT(1) receptors. J Am Soc Nephrol. 2002;13:1131–1135. doi: 10.1097/01.asn.0000013292.78621.fd. [DOI] [PubMed] [Google Scholar]
- 29.Lantelme P, Rohrwasser A, Vincent M, Cheng T, Gardier S, Legedz L, Bricca G, Lalouel JM, Milon H. Significance of urinary angiotensinogen in essential hypertension as a function of plasma renin and aldosterone status. J Hypertens. 2005;23:785–792. doi: 10.1097/01.hjh.0000163147.20330.f5. [DOI] [PubMed] [Google Scholar]
- 30.Wang E, Yayama K, Takano M, Okamoto H. Sexual dimorphism of urine angiotensinogen excretion in the rat. Jpn J Pharmacol. 1994;64:243–250. doi: 10.1254/jjp.64.243. [DOI] [PubMed] [Google Scholar]
- 31.Ellison KE, Ingelfinger JR, Pivor M, Dzau VJ. Androgen regulation of rat renal angiotensinogen messenger RNA expression. J Clin Invest. 1989;83:1941–1945. doi: 10.1172/JCI114102. [DOI] [PMC free article] [PubMed] [Google Scholar]
- 32.Quan A, Chakravarty S, Chen JK, Chen JC, Loleh S, Saini N, Harris RC, Capdevila J, Quigley R. Androgens augment proximal tubule transport. Am J Physiol Renal Physiol. 2004;287:F452–F459. doi: 10.1152/ajprenal.00188.2003. [DOI] [PubMed] [Google Scholar]