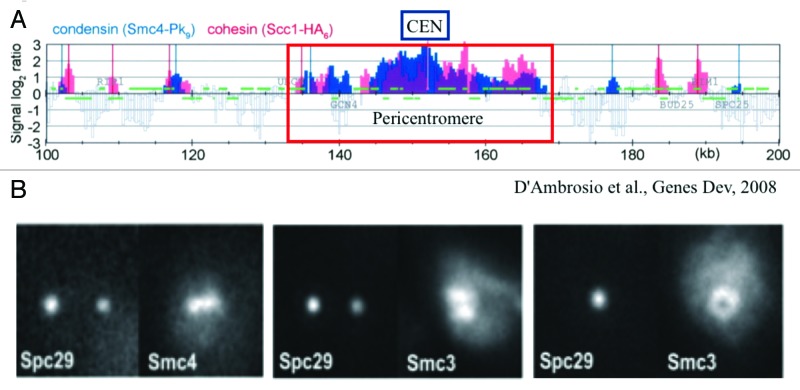
Figure 1. Population distribution vs. single cell distribution of cohesin (Scc1 and Smc3 subunits) and condensin (Smc4). (A) Smc4 and Scc1 are enriched in the pericentromere (~35 kb) surrounding the centromere (CEN). The distribution patterns appear similar in range and intensity. Adapted from reference 9. (B) Fluorescence images of Smc4 and Smc3 in single cells. Three pairs of cells are shown. (left panel) The mitotic spindle is parallel to the plane of focus and the two spindle pole bodies appear as two diffraction spots due to labeling the spindle pole protein Spc29 with RFP. Condensin (Smc4-GFP) appears as a line along the spindle axis between the two spindle poles. (middle panel) The mitotic spindle viewed from the perspective as left. Cohesin (Smc3-GFP) appears as a bi-lobed structure radially displaced from the spindle axis. (right panel) The mitotic spindle is perpendicular to the plane of focus. Only one spindle pole body is in focus (Spc29-RFP). Smc3-GFP is concentrated around the spindle, and appears as a hollow cylinder. Pericentric cohesin (Smc3-GFP) is best modeled as a hollow cylinder surrounding the mitotic spindle (Stephens et al., 2013). The diameter of the cohesin cylinder is ~500 nm, the cylindrical spindle ~250 nm. Adapted from reference 11.

An official website of the United States government
Here's how you know
Official websites use .gov
A
.gov website belongs to an official
government organization in the United States.
Secure .gov websites use HTTPS
A lock (
) or https:// means you've safely
connected to the .gov website. Share sensitive
information only on official, secure websites.
