
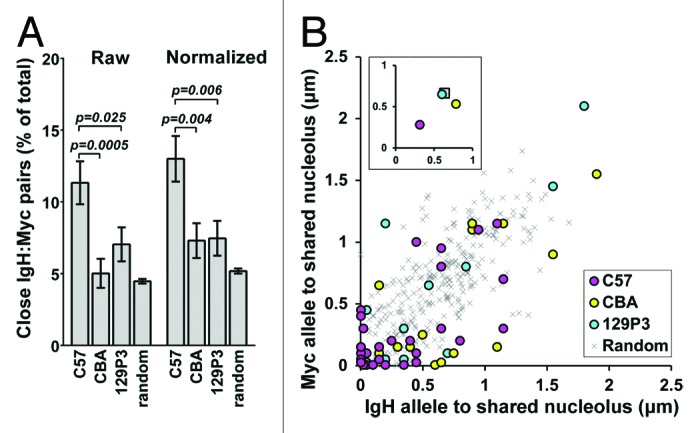
Figure 3. Nucleolar tethering mediates IgH and Myc gene pairing. (A) Percentage of total pairwise IgH:Myc measurements with genes positioned ≤1 µm apart (Raw) or ≤20% of the nuclear diameter apart (normalized). (B) For close IgH:Myc gene pairs, the distance from the IgH allele (x axis) and Myc allele (y axis) to the closest shared nucleolus is plotted. C57, magenta; CBA, yellow; 129P3, cyan; random simulations, gray x. Inset: Average position for each strain. Coloration as above but random gene pairs are represented as a gray square.