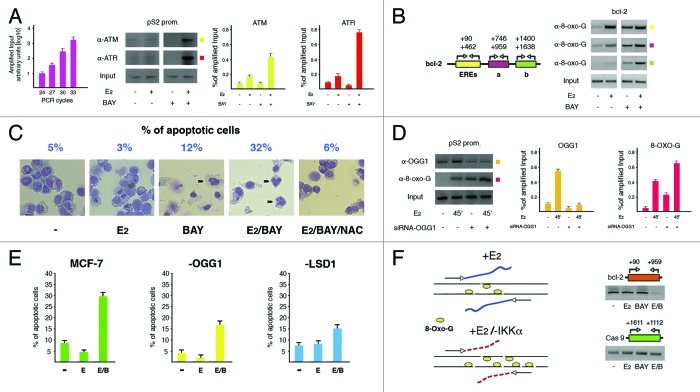
Figure 1. Excess of nicks on DNA finally results into apoptosis. (A) ChIP analysis showing the effect of inhibition of IKKα activity with BAY11-7082 (BAY, 20 μM) on specific recruitment of ATM and ATR kinases to pS2 promoter after E2 treatment for 45 min. The DNA region (reported on top of each gel) has been amplified by fixed PCR reactions realized within the range of cycles with exponential duplication of template sequences from sonicated chromatin before immunoprecipitation (Input, as graphically plotted on the left). The antibodies used are indicated on the left of an illustrative gel that, as in the following panels, represents one of at least three different experiments. All shown bands have been quantified and plotted in graphs whose values revealed a statistical significance where 0.05 ≥ P ≥ 0.01. Error bars represent SEM. Even though illustratively reported only in panel D of Figure 2, antibodies to α-Tubulin have been used in all ChIP experiments as negative control; in addition, an intronic fragment of the same gene has been used as negative control to assess site-specificity of protein recruitment (not shown). (B) Evaluation upon the same tool of boundaries of the DNA oxidation waves along with bcl-2 coding region that harbors the EREs, in wild type and IKKα-inhibited cells.11 Location of primer pairs used in PCRs is reported on the left. (C) Estimate of the percentage of apoptotic MCF-7 cells challenged with E2 (10 nM) for 24 h, in the absence or presence of BAY11-7082 (20 μM) added for the first 6 h. Addition of 25 mM NAC to IKKα-inhibited/E2-challenged cells (6 h as for BAY) highlighted the role of ROS in hormone effect. Evocative fields of cells stained with May Grünwald-Giemsa and photographed by light microscopy with apoptotic nuclei evidenced by black arrowheads have been reported. For each treatment, 500 cells have been counted and the apoptotic fraction (representing the mean of three different experiments) is indicated on top. (D) ChIP assays revealing the effect of OGG1 silencing on presence of oxidized Gs near pS2 promoter. Assessment of the specific knock down has been evaluated by presence of OGG1 on the same promoter. (E) The same cells have been analyzed by FACS in order to evaluate the apoptotic fraction after addition of E2 or E2/BAY. Wild-type and LSD1-knocked down cells have been used as basis for comparison. Levels of silenced LSD1 have been determined as reported in panel A of Figure 2. (F) Estimate by dedicated PCR reactions of the DNA damage induced by E2, BAY or E2/BAY added for 6 h to MCF-7 cells. DNA sonicated in order to obtain fragments of 800–1000 base pairs was quantified and equal amounts (20 ng) were amplified in PCRs with primer pairs spanning a region from bcl-2 EREs to approximately 500 bp downstream, as detailed on top of the reported gel. Graphic representation of the effect on DNA of IKKα inhibition in E2-challenged cells is reported on the left. Amplification of the coding region of the RA-responsive caspase 9 gene has been used as control.

An official website of the United States government
Here's how you know
Official websites use .gov
A
.gov website belongs to an official
government organization in the United States.
Secure .gov websites use HTTPS
A lock (
) or https:// means you've safely
connected to the .gov website. Share sensitive
information only on official, secure websites.
