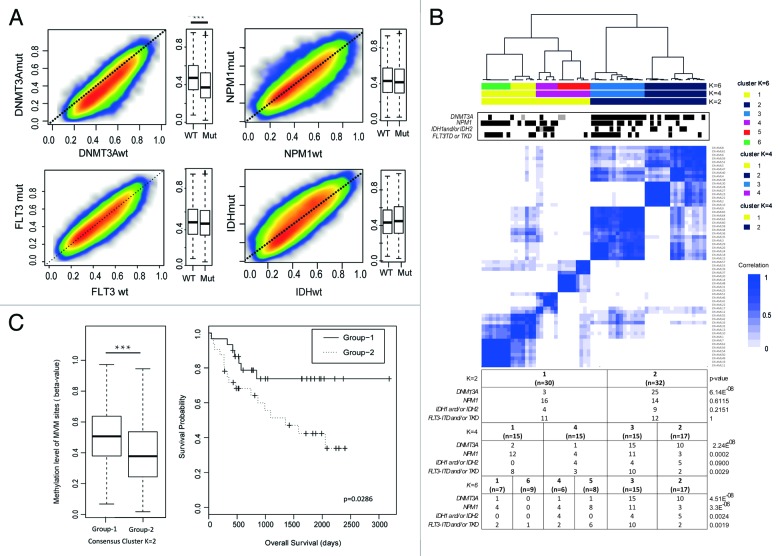
Figure 2. Association profile between global methylation patterns and mutational status of CN-AML cases. In total, the 41723 most variably methylated CpG (MVM) sites were selected by choosing sites with a standard deviation of β-values higher than 0.15 across all 62 patient samples. (A) Smoothed scatter plots and boxplots of general methylation levels according to gene mutational status (mutated vs. wild type) on MVM sites. CN-AML patients were divided according to each gene mutational status and average methylation levels of mutated vs. wild type cases were plotted in parallel to scatterplot and boxplots (DNMT3A mutated vs. wild type, Wilcoxon Sum rank P < 10−3) (B) Unsupervised consensus cluster plot showing the correlation of global methylation patterns of 62 CN-AML patients. Patients were sequentially segregated into 2 to 6 clusters (K2 to K6) according to the correlation of methylation patterns (Fig. S4). K2, K4 and K6 clusters are shown in the plot with a color code. The mutational statuses of the corresponding patients are marked (mutated cases in black, not known in gray). Statistical analysis was performed validating the distribution of indicated gene mutations among patient groups in K2 to K6 clusters by Fisher’s exact test. (C) Average methylation levels of patients according to K2 cluster are shown in the left panel (Wilcoxon sum rank test, P < 10−4) and a Kaplan-Meier diagram shows the prognostic difference of patients divided according to K2 cluster (log-rank test, P = 0.0296)

An official website of the United States government
Here's how you know
Official websites use .gov
A
.gov website belongs to an official
government organization in the United States.
Secure .gov websites use HTTPS
A lock (
) or https:// means you've safely
connected to the .gov website. Share sensitive
information only on official, secure websites.
