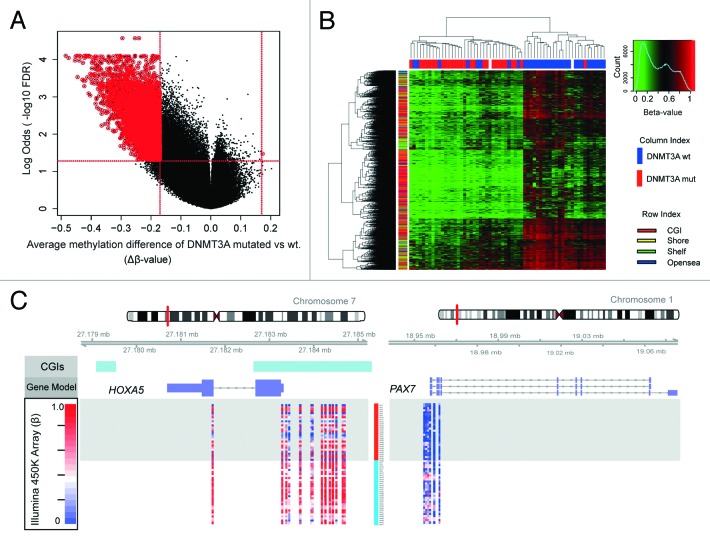
Figure 3. Hypomethylation in DNMT3A mutated patients. Patients were separated according to DNMT3A mutational status and, in total, 5074 DNM3A-DMC were defined by FDR < 0.05 and |∆β| > 0.17. (A) Volcano plot shows methylation differences of DMC between DNMT3A mutated vs. wild type CN-AML cases (DNMT3A-DMC; FDR < 0.05, |∆β| > 0.17). DMCs are marked with red circles. X-axis shows the FDR odd ratios (-log10 FDR) and Y-axis shows the average difference between mutated and wild type cells. (B) Heatmap of DNMT3A-DMC. The mutational status is color-coded in the column index, mutated is shown in red and wild type is shown in blue. The CpG regions of DNMT3A-DMC are presented in rows (CGI in red, shores in yellow, shelves in green and open sea in blue). (C) Hypomethylation of HOXA5 and PAX7 in DNMT3A mutated CN-AML. DNMT3A-DMC of HOXA5 and PAX7 are shown in the diagram. Methylation levels are plotted according to chromosomal positions (β-value, scale 0 to 1.0). Patients are color-coded according to DNMT3A mutational status (mutated in red and wild type in blue). Schematic graphs and annotated CpG islands (CGIs in light blue) were obtained from USCS Genome browser.

An official website of the United States government
Here's how you know
Official websites use .gov
A
.gov website belongs to an official
government organization in the United States.
Secure .gov websites use HTTPS
A lock (
) or https:// means you've safely
connected to the .gov website. Share sensitive
information only on official, secure websites.
