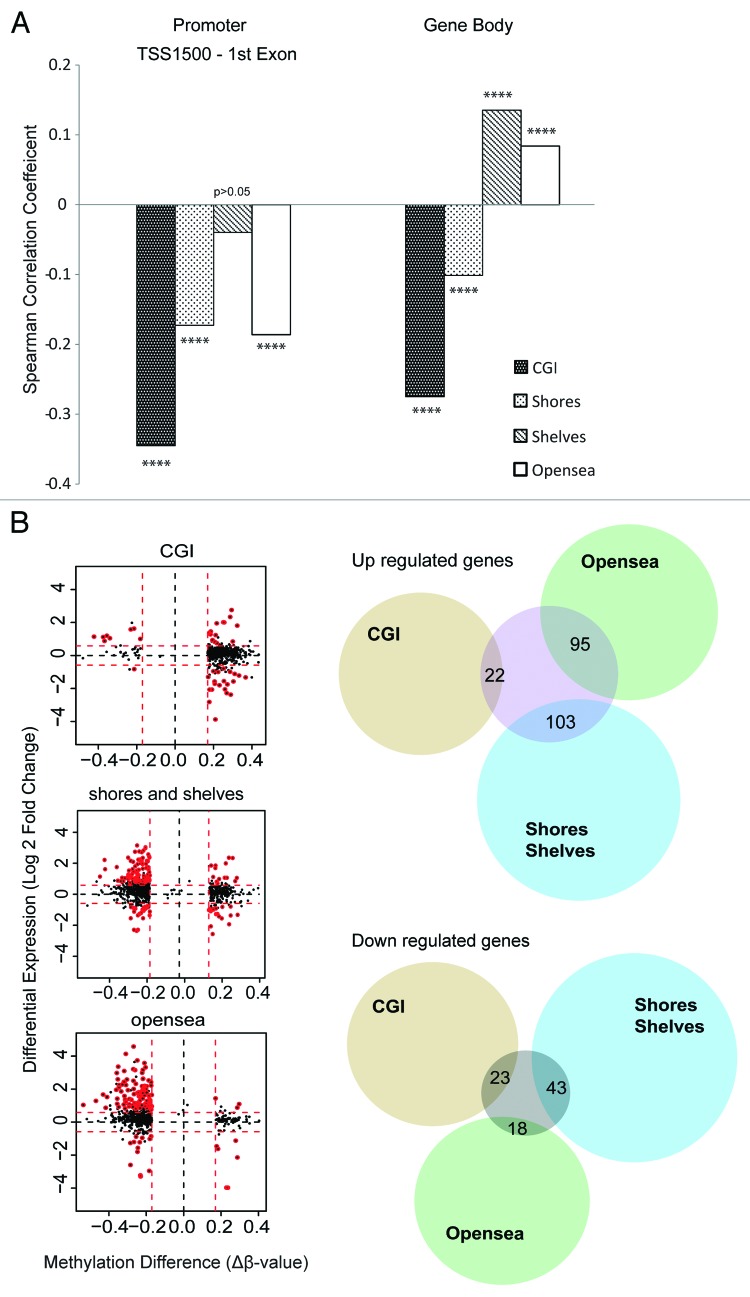
Figure 5. Correlation between DNA methylation and gene expression. (A) Correlation between average DNA methylation and average gene expression of all genes represented on both methylation and expression arrays. Promoter and gene body methylation was summarized for each type of CpG region (in relation to CGI). Correlation coefficient was tested by Spearman’s correlation test. (B) Association between differentially methylated and differentially expressed genes within the CGI and open sea-associated promoters, respectively. All genes with significant differential methylation were plotted in the figure. In the left panel, the X-axis shows methylation difference in average β-value (∆β-value) between CN-AML and CD34+ controls; Y-axis shows changes in expression as log 2-transformed fold change. Differentially expressed genes are marked in red circles. Proportional Venn diagrams (right panel) show the differential expression corresponding to methylation changes in different CpG regions (tested by Fisher’s exact test).

An official website of the United States government
Here's how you know
Official websites use .gov
A
.gov website belongs to an official
government organization in the United States.
Secure .gov websites use HTTPS
A lock (
) or https:// means you've safely
connected to the .gov website. Share sensitive
information only on official, secure websites.
