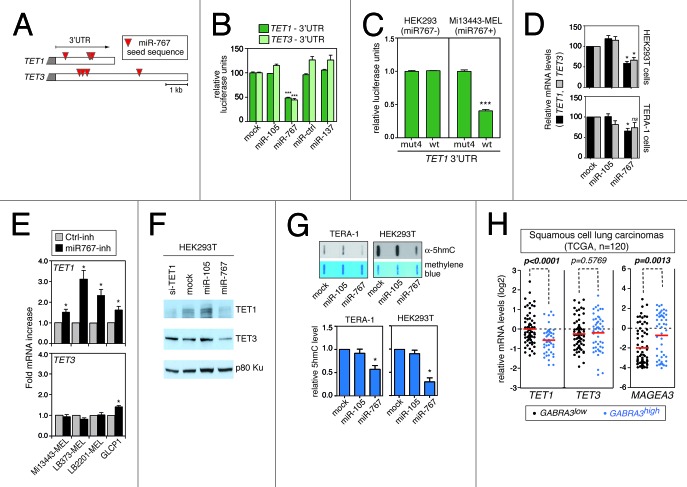
Figure 3. miR-767 controls TET1 and TET3 expression levels and regulates cellular 5hmC levels. (A) Red triangles indicate the location of miR-767 seed sequences (7-mer and 8-mer) in TET1 and TET3 3′-UTRs. (B) HEK293T cells were co-transfected with a luciferase reporter linked to the 3′-UTR of either TET1 or TET3, and with the indicated miRNAs (miR-Ctrl and miR-137 served as a negative control). Normalized luciferase activities, which were measured 24h after transfection, are expressed relative to mock cells (no miRNA transfected), and represent means ± SEM (n = 3). *** P < 0.001 for comparison to mock cells (Bonferroni's multiple comparison test). (C) HEK293 cells (miR-767 negative) and Mi13443-MEL cells (miR-767 positive) were stably transfected with a luciferase reporter vector carrying either the wild-type (wt) 3′-UTR of TET1 or a mutant version of the 3′-UTR (mut4), lacking the four miR-767 target sequences. Relative luciferase units represent mean ± SEM (n = 3). *** P < 0.001. (D)TET1 and TET3 mRNA levels were evaluated by RT-qPCR three days after transfection of miR-105 (serving as negative control) or miR-767. Normalized mRNA levels (ratio to ACTB) are expressed relative to mock cells (no miRNA transfected). Values represent mean ± SEM (n ≥ 3). * P < 0.05, for comparison to mock cells (Friedman test with Dunn’s multiple comparison test). (E) miR-767-expressing melanoma cell lines (-MEL) and non-small cell lung carcinoma cell line (GLCP1) were transfected with a LNA inhibitor of miR-767 (miR767-inh) or an irrelevant control LNA inhibitor (Ctrl-inh). TET1 and TET3 mRNA expression levels were assessed by RT-qPCR. Values represent mean ± SEM (n = 3). * P < 0.05 (Wilcoxon signed rank tests). (F) HEK293T cells transfected with the indicated miRNA or siRNA were subjected to western blot analysis for TET1 and TET3 proteins (p80-Ku was assessed to verify equal loading). (G) Genomic 5hmC levels were evaluated by slot blot analysis at day 3 after transfection with the indicated miRNA. Blots were stained with methylene blue to control for loading. Representative blots are shown out of three to five repeats. Quantification of slot blot data was performed. Normalized 5hmC levels are expressed relative to mock-transfected cells, and represent mean ± SEM * P < 0.05 (Friedman test with Dunn’s multiple comparison test). (H) Analysis of microarray data derived from the TCGA collection of lung squamous cell carcinomas (n = 120) revealed significant downregulation of TET1 (but not TET3) in tumor cells that show upregulation of miR-767-harboring GABRA3 transcripts. Positive correlation between GABRA3 and MAGEA3 activation confirmed the validity of the test. Red bars indicate mean mRNA levels. P values were determined by unpaired t tests.

An official website of the United States government
Here's how you know
Official websites use .gov
A
.gov website belongs to an official
government organization in the United States.
Secure .gov websites use HTTPS
A lock (
) or https:// means you've safely
connected to the .gov website. Share sensitive
information only on official, secure websites.
