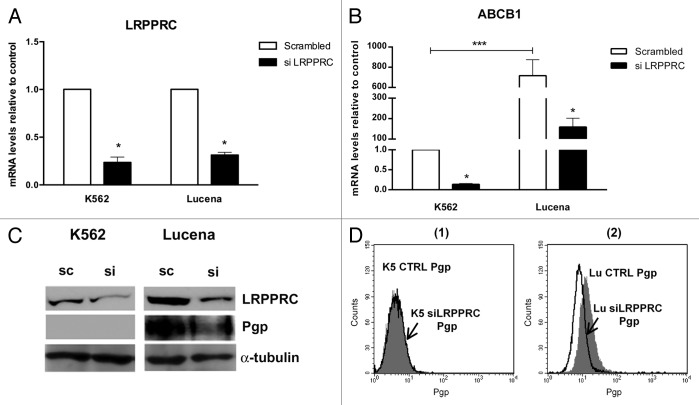
Figure 2. Expression of ABCB1/Pgp levels after LRPPRC depletion in CML cell lines. (A)Analysis of LRPPRC mRNA levels after transient LRPPRC knockdown in K562 and Lucena cells. (B)Analysis of ABCB1 mRNA levels after siLRPPRC. Total RNA was isolated and used in RT-qPCR analysis to determine changes in LRPPRC and ABCB1 mRNA levels after normalization to β-actin expression. All data are presented as fold inductions relative to control group expression (scrambled). (C)Representative western blot analysis of LRPPRC and Pgp expression. Protein extract (50 μg) from both cell lines were separated on a 12% SDS-PAGE gel and probed with anti- LRPPRC and anti-MDR1 antibodies. α-tubulin was used as a loading control. (D) Representative histograms of Pgp expression after 50 nM siLRPPRC (1): K562 ctrl and siLRPPRC (2): Lucena ctrl and siLRPPRC cells. PE-isotype antibody was used as a control. The results are expressed as the mean ± SD for three independent experiments. Ctrl: control; Sc: scrambled; Si: siRNA; K5: K562; LU: Lucena.

An official website of the United States government
Here's how you know
Official websites use .gov
A
.gov website belongs to an official
government organization in the United States.
Secure .gov websites use HTTPS
A lock (
) or https:// means you've safely
connected to the .gov website. Share sensitive
information only on official, secure websites.
