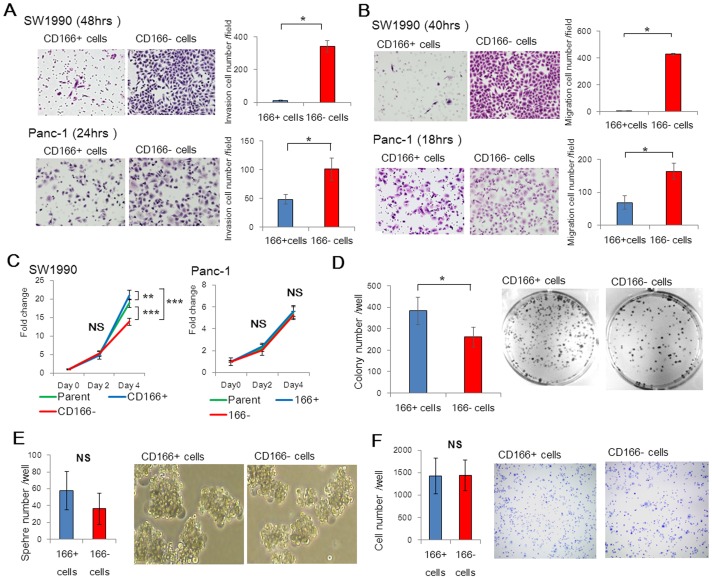
Figure 3. CD166- cells show high invasive and migratory activities.
(A) Invasion assays of CD166+ and CD166- cells derived from SW1990 and Panc-1 cell lines were performed by culturing the cells on Matrigel-coated transwell inserts. After the indicated times, the cells on the lower membrane of the inserts were stained with H&E (representative images are shown) and quantified. (B) Migration assays of CD166+ and CD166- cells from SW1990 and Panc-1 cell lines were performed by culturing the cells on inserts. After the indicated times, the cells on the lower membrane of the inserts were stained with H&E (representative images are shown) and quantified. Original magnification: 200×. (C) Proliferation of CD166+ and CD166- cells derived from SW1990 and Panc-1 cell lines was measured at the indicated times post-initial seeding. (D) Quantification and representative images of the colony formation capacities of CD166+ and CD166- Panc-1 cells. (E) Quantification and representative images of the sphere formation capacities of CD166+ and CD166- Panc-1 cells. (F) Quantification and representative images of the adhesive capacities of CD166+ and CD166- Panc-1 cells. Original magnification: 40×. Data represent the mean ± SD; *, p<0.05; **, p<0.01; ***, p<0.0001; NS, not significant.

