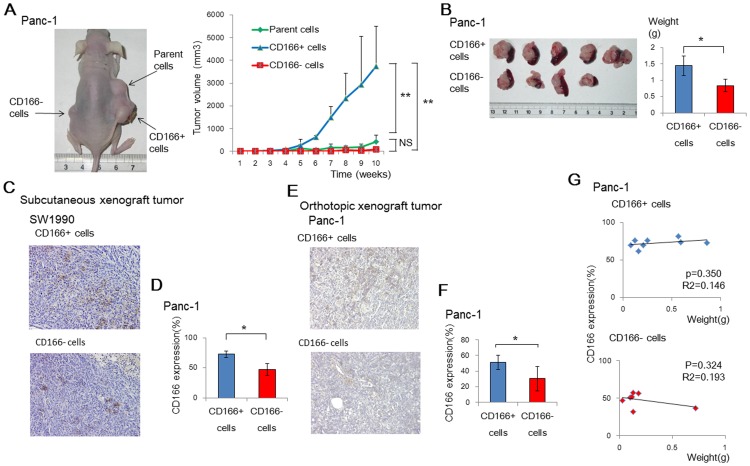
Figure 4. CD166+ cells show strong tumorigenicity in mouse xenograft models.
(A) Mice were subcutaneously transplanted with parental, CD166+, and CD166- cells from the Panc-1 cell line (representative image), and tumor volumes were regularly measured for 7 weeks. (B) Mouse orthotopic tumor xenograft models were also generated from CD166+ and CD166- Panc-1 cells. Tumors were excised and wet weighed. (C, E) Immunohistochemical analysis of CD166 in subcutaneous (C) and orthotopic (E) tumors derived from CD166+ and CD166- SW1990 and Panc-1 cells. Original magnification: 100×. (D, F) CD166 expression was analyzed in subcutaneous (D) and orthotopic (F) tumors derived from CD166+ and CD166- cells by flow cytometry. (G) Analysis of the relationship between tumor weight and the positivity rate of CD166 cells in orthotopic tumors derived from CD166+ and CD166- Panc-1 cells. All graphs show the mean ± SD; *, p<0.05, **, p<0.01.

