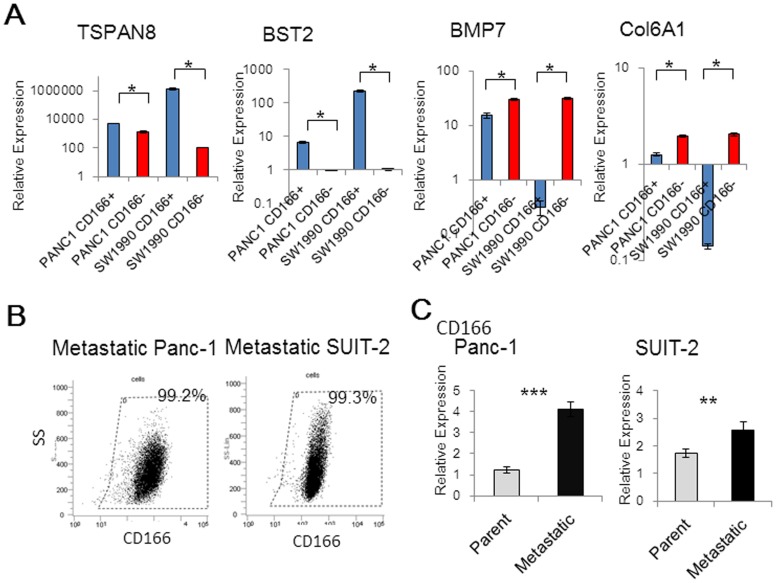
Figure 6. Over-expression of TSPAN8 and BST2 in CD166+ cells, and BMP7 and Col6A1 in CD166- cells.
(A) qRT-PCR was used to analyze the mRNA levels of TSPAN8, BST2, BMP7, and Col6A1, which were found to be up-regulated by more than 2-fold in CD166+ and CD166- cells in comparisons of microarray data. (B) The positivity rate of CD166 in metastatic Panc-1 and metastatic SUIT-2 cell lines was measured by flow cytometry. (C) qRT-PCR analysis was also used to examine CD166 mRNA levels in the metastatic cell lines. Data represent the mean ± SD; *, p<0.05, **, p<0.01, ***, p<0.001.

