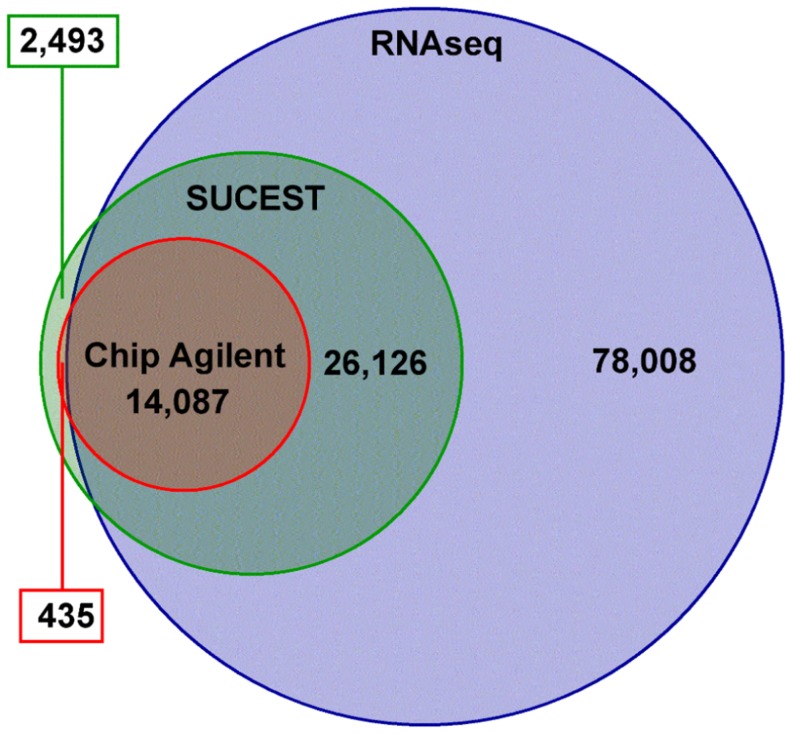
Figure 3. Venn diagram comparing sugarcane transcripts as obtained by RNAseq (blue, this work), SUCEST (green) [51], and those that have been studied using oligoarrays in customized Agilent sugarcane chip (red) [26], [64].
Green and red boxes show the number of transcripts present in the SUCEST data (green) and the Agilent Chip (red) but not in the sugarcane ORFeome (this work).

