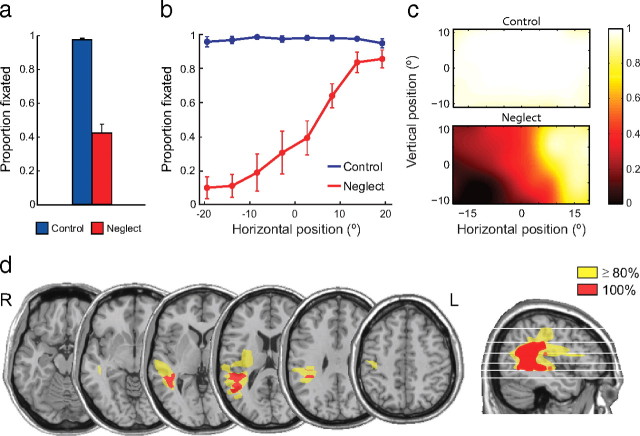
Figure 2.
Goal-directed orienting to targets. a, Proportion of targets fixated by healthy controls (blue) and neglect patients (red). Error bars indicate SEM. b, Proportion of targets fixated as a function of the horizontal position of the target, showing a gradient of impairment in patients increasing from right to left. c, Heat maps show the proportion of targets fixated by controls (top) and patients (bottom) as a function of two-dimensional target position (bicubic interpolation between target locations). Note the greater impairment in patients for inferior as well as leftward targets. d, Overlap map shows the location of lesions in the neglect group. The only area affected in all patients (red) involves the posterior parietal cortex and temporoparietal junction.

