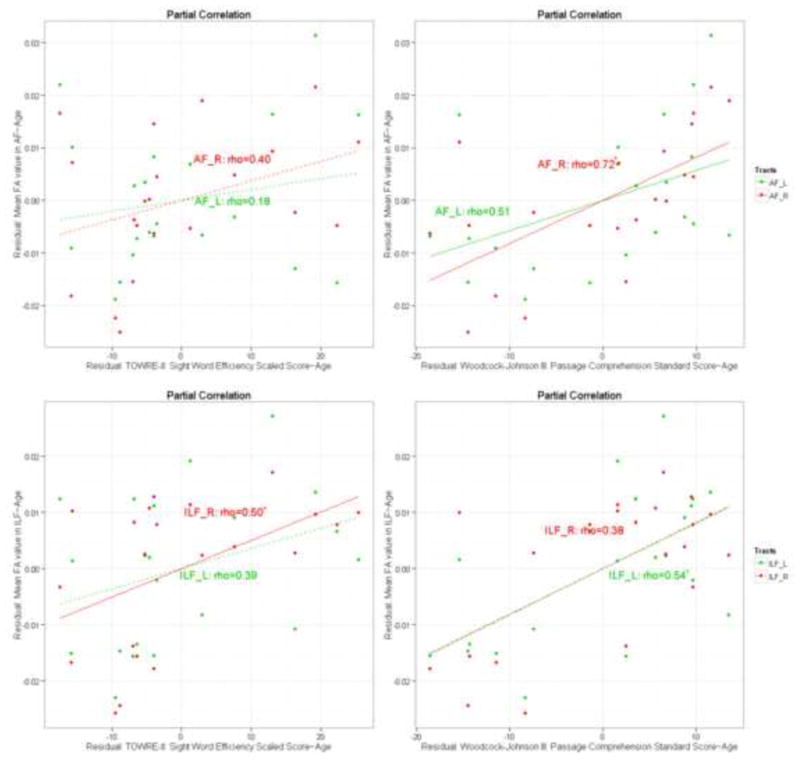
Figure 2.

Partial correlation plots (controlling for age) for mean FA values from two atlas-based fiber tracts within the TBSS skeleton: [A-1]: Mean FA values in the AF correlates with the TOWRE-II; [A-2]: Mean FA values in the AF correlates with WJ-III; [I-1]: Mean FA values in the ILF correlates with the TOWRE-II: [I-2]: Mean FA values in the ILF correlates with WJ-III.
