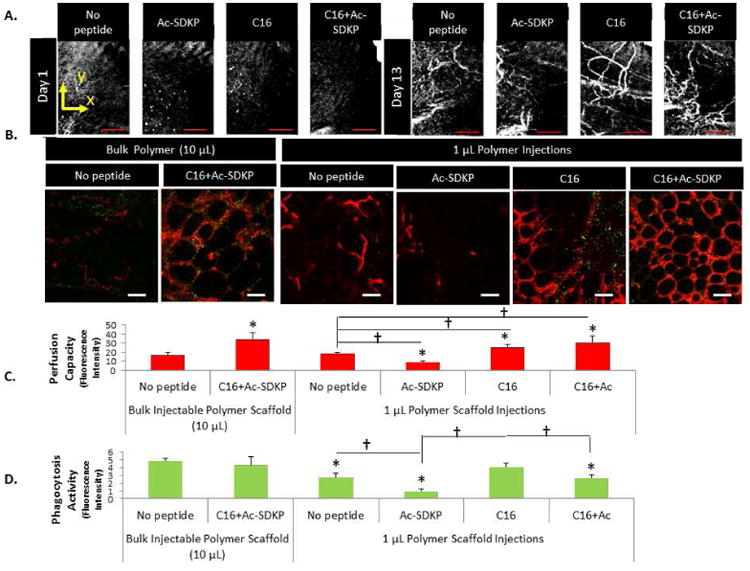
Figure 4. Angiogenesis and phagocytic activity in injectable microgels.

A) Maximum intensity projections of 3D speckle-variance OCT scans were taken of the mouse calf muscle at day 14 after femoral artery ligation and ten, 1 μL intramuscular injections of peptide-polymer microgels around the site of femoral artery ligation. Scale bar = 1mm. B) Blood vessel formation (red) and macrophages phagocytosing E.coli particles (yellow-green) were visualized in tissue with peptide-loaded injectable polymer microgels. Scale bar = 50 μm. C) Vessel perfusion capacity as measured by red fluorescence intensity of perfused microspheres extracted from microgels. D) Phagocytic activity (fluorescence intensity per image field). (C,D) Data are means ± SEM from four-six mice per condition. *p < 0.05 vs. no peptide treatment in same group (Bulk injection or 1μL injections of microgels); *p<0.05 vs. bulk injection with no peptide; †p<0.05 vs. groups connected by lines (Tukeys' Range Test).
