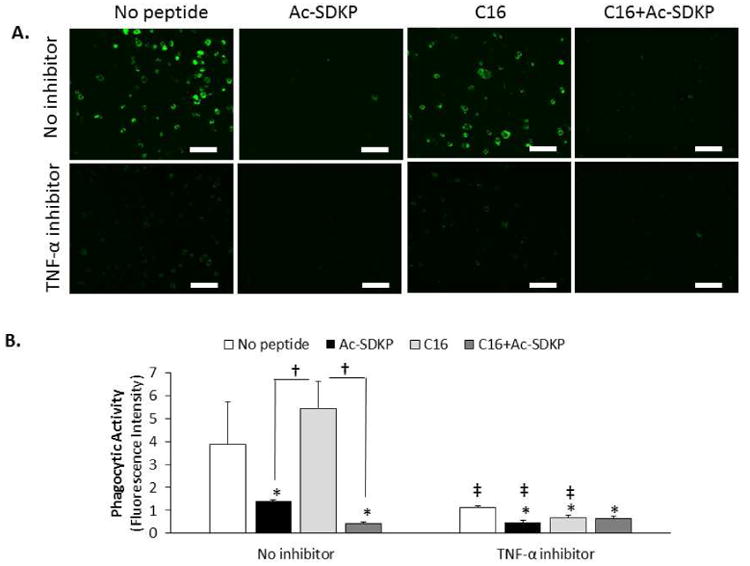
Figure 7. Phagocytic Activity of RAW 264.7 macrophages with TNF-α inhibition.

A) RAW 264.7 macrophages were cultured with peptides (75 μg/mL) and TNF-α antibodies (5 μg/mL) as an inhibitor of TNF-α for 72 hours. Images representative of phagocytic activity of macrophages after incubating with green fluorescent E. coli particles (n=4). Scale bar = 100 μm. B) Phagocytic activity was quantified by the green fluorescence intensity. Data are means ± SEM. *p < 0.05 vs. no peptide treatment in same condition (no inhibition or TNF-α inhibition); † p<0.05 between groups connected by lines; ‡p<0.05 vs. same peptide treatment without inhibitor (n=4; Tukeys' Range Test).
