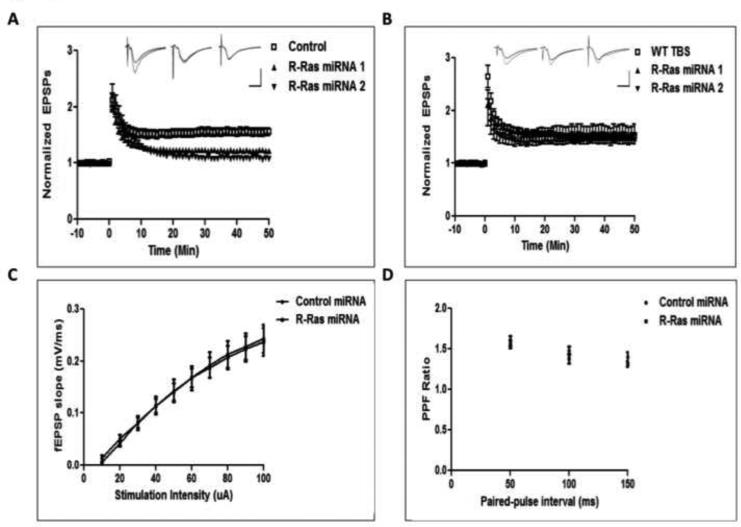
Figure 2. R-Ras knockdown impairs HFS- but not TBS-LTP.
A. Viruses expressing either control miRNA, R-Ras miRNA1 (R-Ras1) or R-Ras miRNA2 (R-Ras2) were injected into CA1 and tested for HFS-LTP induction. (Control-HFS 157 ± 7.4%; R-Ras miRNA1-HFS, 127 ± 3.6%; R-Ras miRNA2-HFS, 122 ± 2.6%; Two-Way ANOVA, miRNA effect, F2,1298 = 13.89, p = 0.0001). Inset shows representative traces for control, R-Ras1, and R-Ras2 miRNAs, respectively. Calibration: Horizontal = 10ms, Vertical = 1mV. B. A separate group of mice injected with viruses expressing R-Ras miRNA1 or R-Ras miRNA2 were tested for TBS-LTP induction in area CA1. (WT-TBS, 159 ± 4.1%; R-Ras miRNA1-TBS, 149 ± 2.7%; R-Ras miRNA2-TBS, 154 ± 16.3%; Two-Way ANOVA, miRNA effect, F 2,767 = 0.64, p = 0.64). Inset shows representative traces for control, R-Ras1, and R-Ras2 miRNAs, respectively. Calibration: Horizontal = 10ms, Vertical = 1mV. C. Input-output relationship is normal in cells infected with R-Ras miRNA compared to control miRNA in area CA1 (Two-Way ANOVA, miRNA × intensity, F 9,108 = 0.05, p = 1.00). D. Paired-pulse facilitation is normal in cells infected with R-Ras miRNA compared to control miRNA in area CA1 (Two-Way ANOVA, miRNA × interval, F 2,36 = 0.64, p = 0.53).

