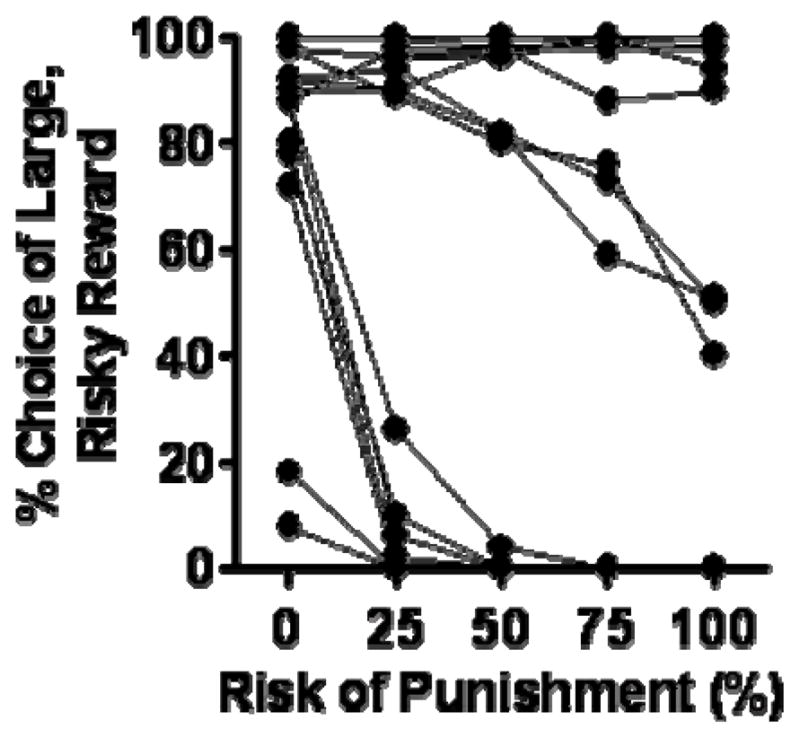
Figure 3.

Individual rats’ performance in the RDT in Experiment 2. Each line represents data from an individual rat (averaged across five consecutive sessions of stable performance). Within this cohort there was a bi-modal distribution of performance into risk taking and risk averse subgroups.
