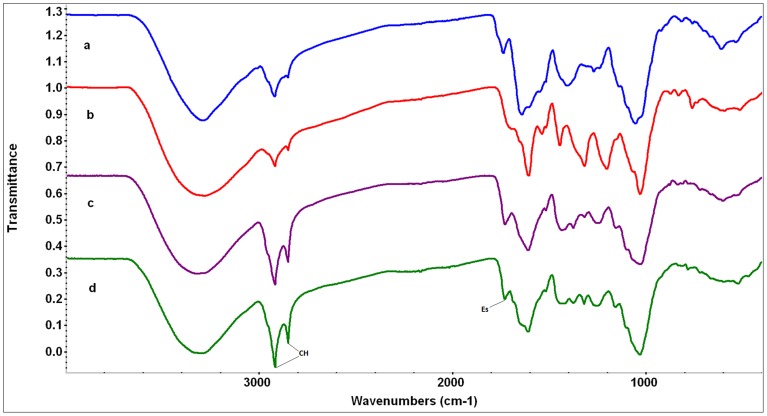
Figure 2. FTIR spectra of narrow gypsum endemisms.
The scale of the Y axis is offset for illustration purposes. a) Centarurea hyssopifolia (blue), b) Helianthemum marifolium subsp. conquense (red), c) Teucrium pumilum (purple), d) Thymus lacaitae (green). Abbreviations of compound peaks: CH: CH-stretching, Es: Esters.

