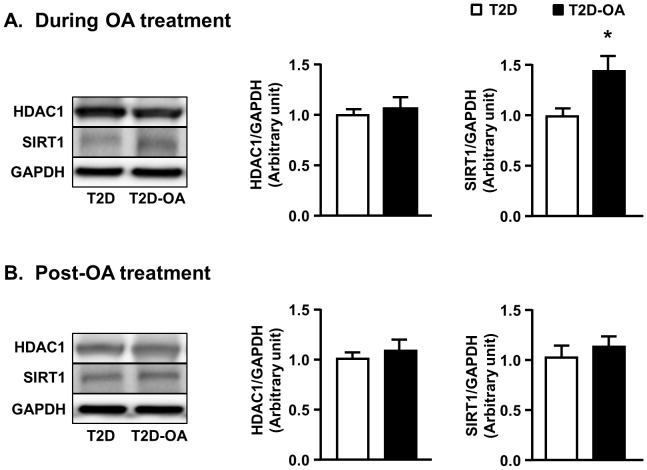
Figure 4. Changes in Class I HDAC and SIRT1 in the liver.
Mice liver samples were freeze-clamped after 4 weeks of OA administration (During OA treatment) (A) or 4 weeks after the cessation of OA administration (Post-OA treatment) (B). Liver lysates from mice were immunoblotted with HDAC1 (Class I HDAC) and SIRT1 (Class III HDAC) and quantified for statistical analysis. Data are mean ± SE. *p<0.05, vs. T2D mice. n = 5–8 mice per group.

