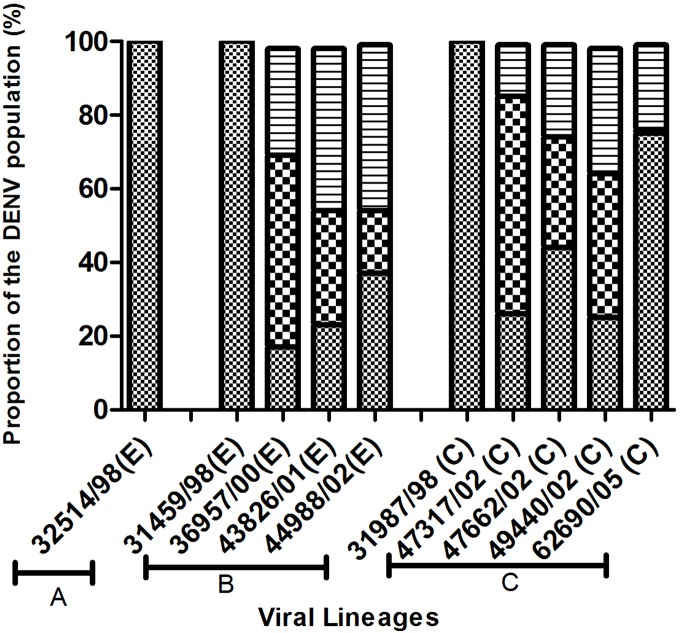
Figure 2. Distribution of fitness within populations of DENV-1 from four lineages.
Populations are identified as strain/year/E (extinct) or C (circulating); proportion more fit than the population average indicated horizontal hatch, same fit as the original population indicated as bold squares and less fit than the original population indicated as small squares.

