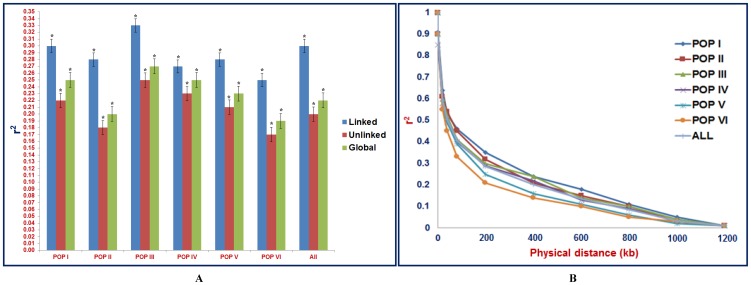
Figure 5. Microsatellite and SNP marker-based estimation of genome-wide and population-specific LD patterns in wild chickpea.
(A) Estimates of LD (mean r2) for linked, unlinked and global markers (478 genic and genomic microsatellite markers and 380 TF gene-based SNP markers). The bar indicates the standard error. *ANOVA significance at p<0.01. (B) LD decay (mean r2) in six population groups as defined by population genetic structure. For LD decay, the r2 value of marker physical distance of 0 kb is considered as 1. The marked dots indicate the mean r2 values for marker intervals of 0–200, 200–400, 400–600, 600–800, 800–1000 and 1000–1200 kb, respectively. The curve was drawn across the dots using non-linear regression model. “All” includes the LD estimates and decay across entire six population groups.

