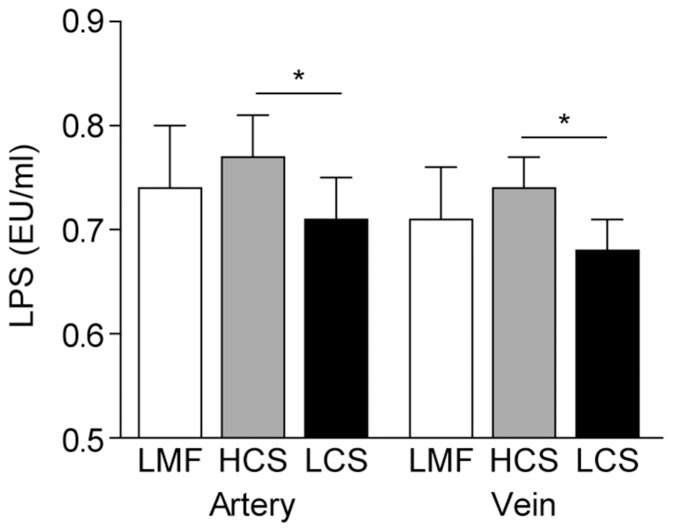
Figure 3. Effect of different diets on LPS concentrations in the mammary artery and vein plasma of dairy cows.
LPS concentrations were quantified by chromogenic end-point assay using the limulus amebocyte lysate (LAL) test reagent kit. Data represent the mean and standard deviation (n = 10/group) and the asterisk indicates statistical difference (p<0.05) between the indicated columns. LMF, low-concentrate mixed forage diet; HCS, high-concentrate corn straw diet; LCS, low-concentrate corn straw diet.

