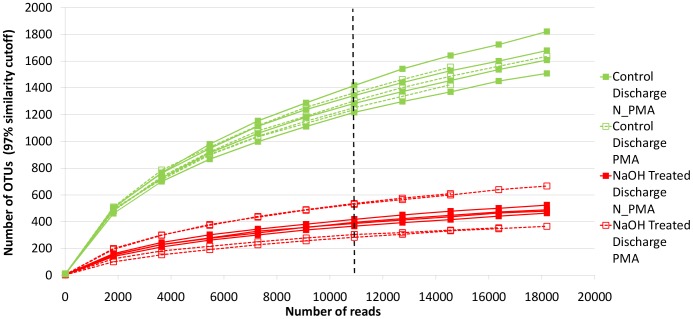
Figure 1. The rarefaction curve of Ion Torrent sequence data.
OTUs were defined at 97% similarity cutoff. The figure depicts the comparison between control discharge and NaOH treated discharge samples. The breaking line was placed at around 11,000 (10,918) reads and OTUs were compared across samples when samples were rarefied at 11,000 (10,918) reads.

