
Figure 5. Quartiles of the distribution of the average variance  and of the average mean,
  , within each group.
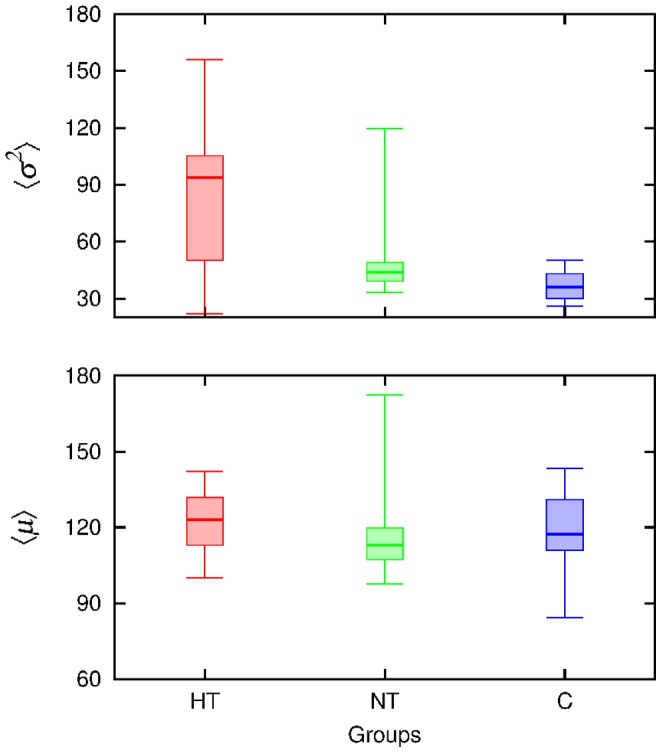
The horizontal lines limit the quartiles, the thicker one indicates the median.
Official websites use .gov
A
.gov website belongs to an official
government organization in the United States.
Secure .gov websites use HTTPS
A lock (
) or https:// means you've safely
connected to the .gov website. Share sensitive
information only on official, secure websites.
and of the average mean, , within each group.
The horizontal lines limit the quartiles, the thicker one indicates the median.