
Figure 11. Normalized maximum  of the power spectrum versus AHI, for each individual.
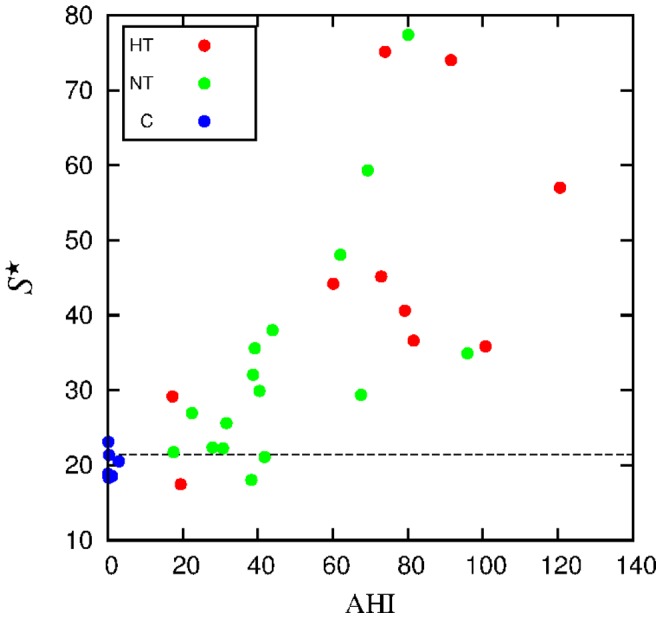
The dashed horizontal line represents the ROC threshold.
Official websites use .gov
A
.gov website belongs to an official
government organization in the United States.
Secure .gov websites use HTTPS
A lock (
) or https:// means you've safely
connected to the .gov website. Share sensitive
information only on official, secure websites.
of the power spectrum versus AHI, for each individual.
The dashed horizontal line represents the ROC threshold.