
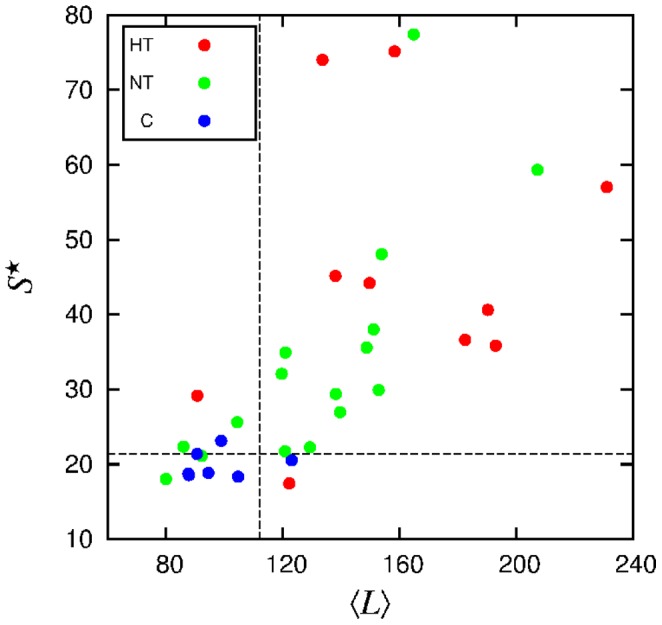
Figure 13. Normalized maximum of the spectral density  vs mean segment length
  , for each individual. Dashed lines represent threshold values.
Official websites use .gov
A
.gov website belongs to an official
government organization in the United States.
Secure .gov websites use HTTPS
A lock (
) or https:// means you've safely
connected to the .gov website. Share sensitive
information only on official, secure websites.
vs mean segment length , for each individual. Dashed lines represent threshold values.