
Figure 3. Type distributions of the 125 combined optimal features.
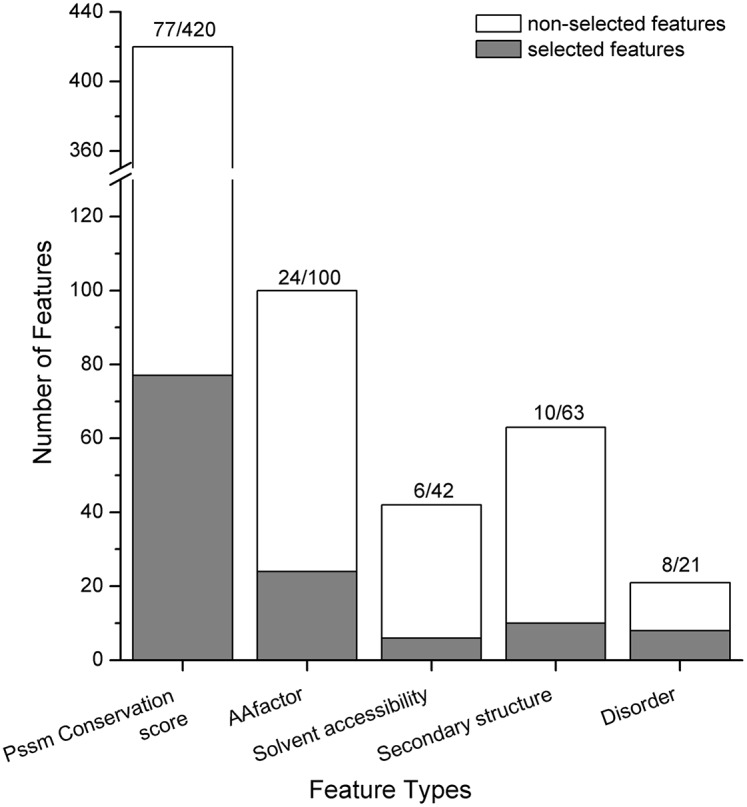
The 125 features were obtained by combining the 3 optimal feature sets for the 3 datasets. The histograms show the number of optimal features belonging to each type, as well as the total number of features of each type.