
Figure 4. Histograms of fractal dimension values.
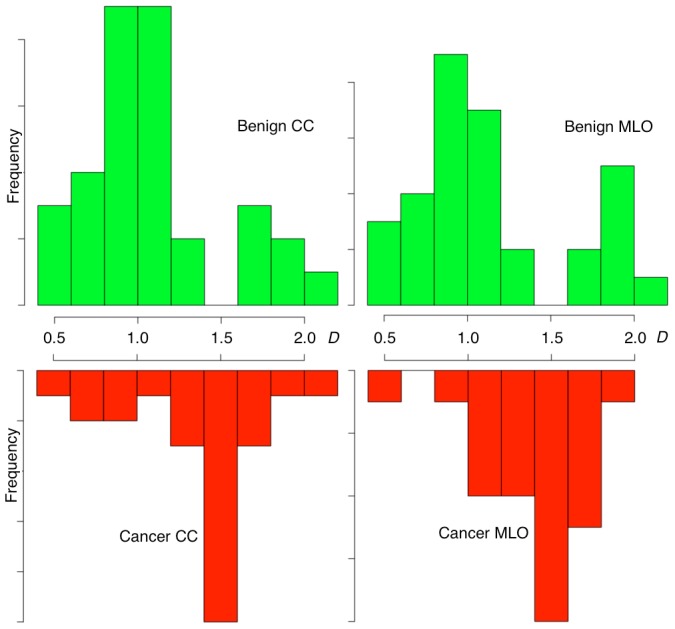
The frequency distributions of fractal dimensions, D (Eq. (16)) calculated for benign CC and MLO views (top) are drastically different than those calculated for the cancer CC and MLO views (bottom).
Official websites use .gov
A
.gov website belongs to an official
government organization in the United States.
Secure .gov websites use HTTPS
A lock (
) or https:// means you've safely
connected to the .gov website. Share sensitive
information only on official, secure websites.
The frequency distributions of fractal dimensions, D (Eq. (16)) calculated for benign CC and MLO views (top) are drastically different than those calculated for the cancer CC and MLO views (bottom).