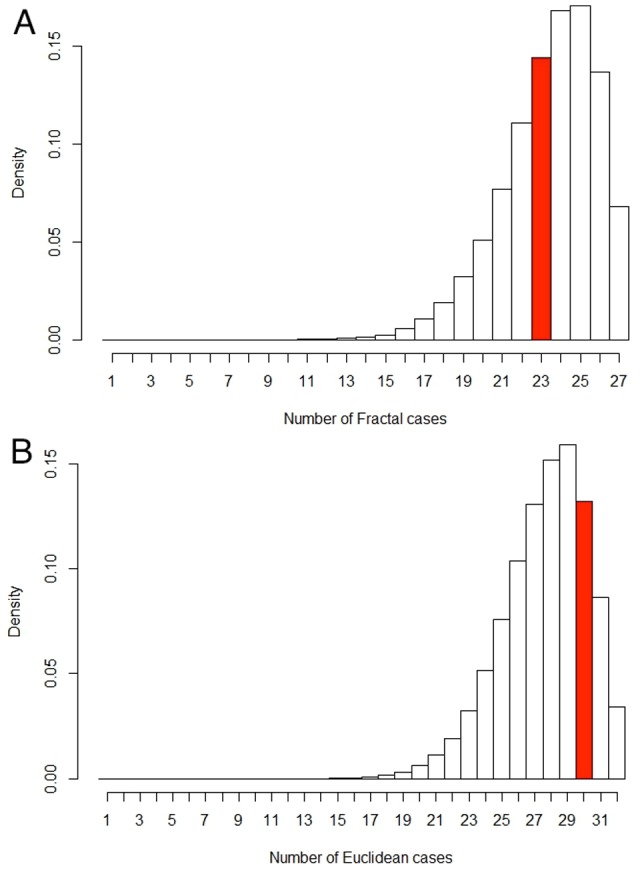
Figure 7. Density histograms of malignant/benign cases out of fractal/Euclidean cases.

(A) Histogram of potential malignant cases out of 27 fractal cases given the posterior distribution p(M|F) (see Methods section). The red bar represents our testing data set of 23 malignant cases out of 27 total fractal cases. The probability of arriving at less than or equal to 23 cases is ∼46%. (B) Histogram of potential benign cases out of 32 Euclidean cases given the posterior distribution p(B|E). The red bar represents our testing data set of 30 benign cases out of a total of 32 Euclidean cases. The probability of arriving at less than or equal to 30 cases is ∼74%. Since 23 malignant cases (A) and 30 benign cases (B) are not towards either end of these distributions resulting from 100,000 “coin-toss” iterations, we can safely say that the respective models are an adequate fit for the data.
