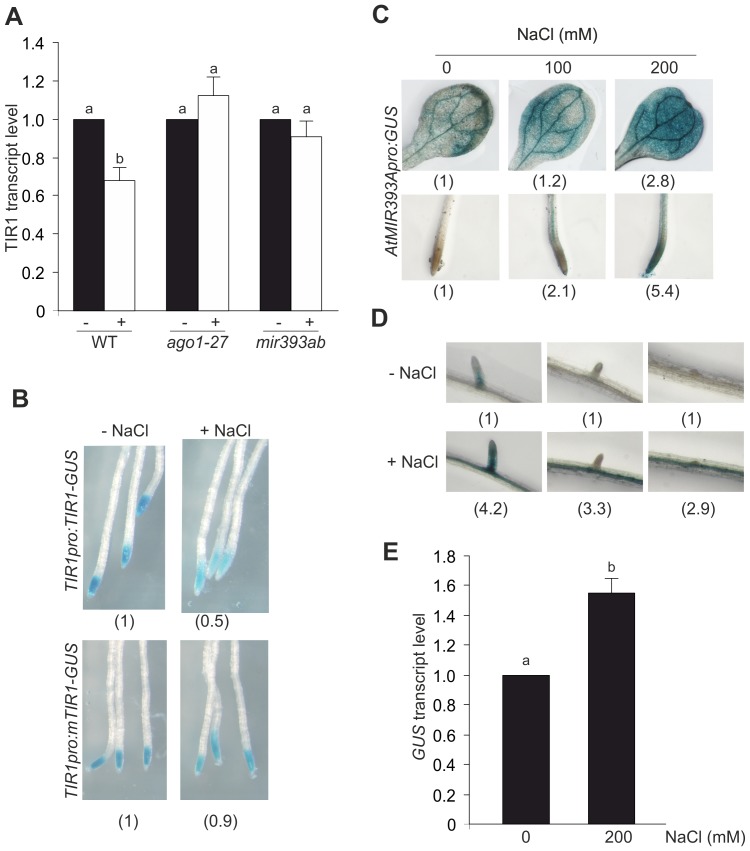
Figure 3. Salt-mediated down-regulation of TIR1 by miRNAs.
(A) Seven dpg WT, ago1-27 and mir393ab seedlings were subjected to 200 mM NaCl treatment for 4 h. Relative transcript level of TIR1 upon treatment was measured by RT-PCR. The control value is arbitrarily set to 1 in each case. Data are mean values (±SE) of three independent experiments. Different letters indicate a significant difference at P≤0.05 (Tukey test). (B) Seven dpg TIR1pro:TIR1-GUS and TIR1pro:mTIR1-GUS seedlings were incubated in liquid ATS medium with NaCl for 4 h and then subjected to GUS staining. Representative photographs of root tips are shown. The control value is arbitrarily set to 1 in each case. Data are mean values of three independent experiments. (C,D) Seven dpg AtMIR393Apro:GUS seedlings were transferred to liquid ATS medium supplemented with increasing concentrations of NaCl for 2 h. GUS activity was revealed after incubation with X-Gluc at 37°C. GUS staining in representative leaves and root segments are shown. The control value is arbitrarily set to 1 in each case. Data are mean values of three independent experiments. (E) Relative transcript level of GUS in NaCl- treated AtMIR393Apro:GUS seedlings was quantified upon treatment. The control value is arbitrarily set to 1 in each case. Data are mean values (±SE) of three independent experiments. Different letters indicate a significant difference at P≤0.05 (Tukey test).

