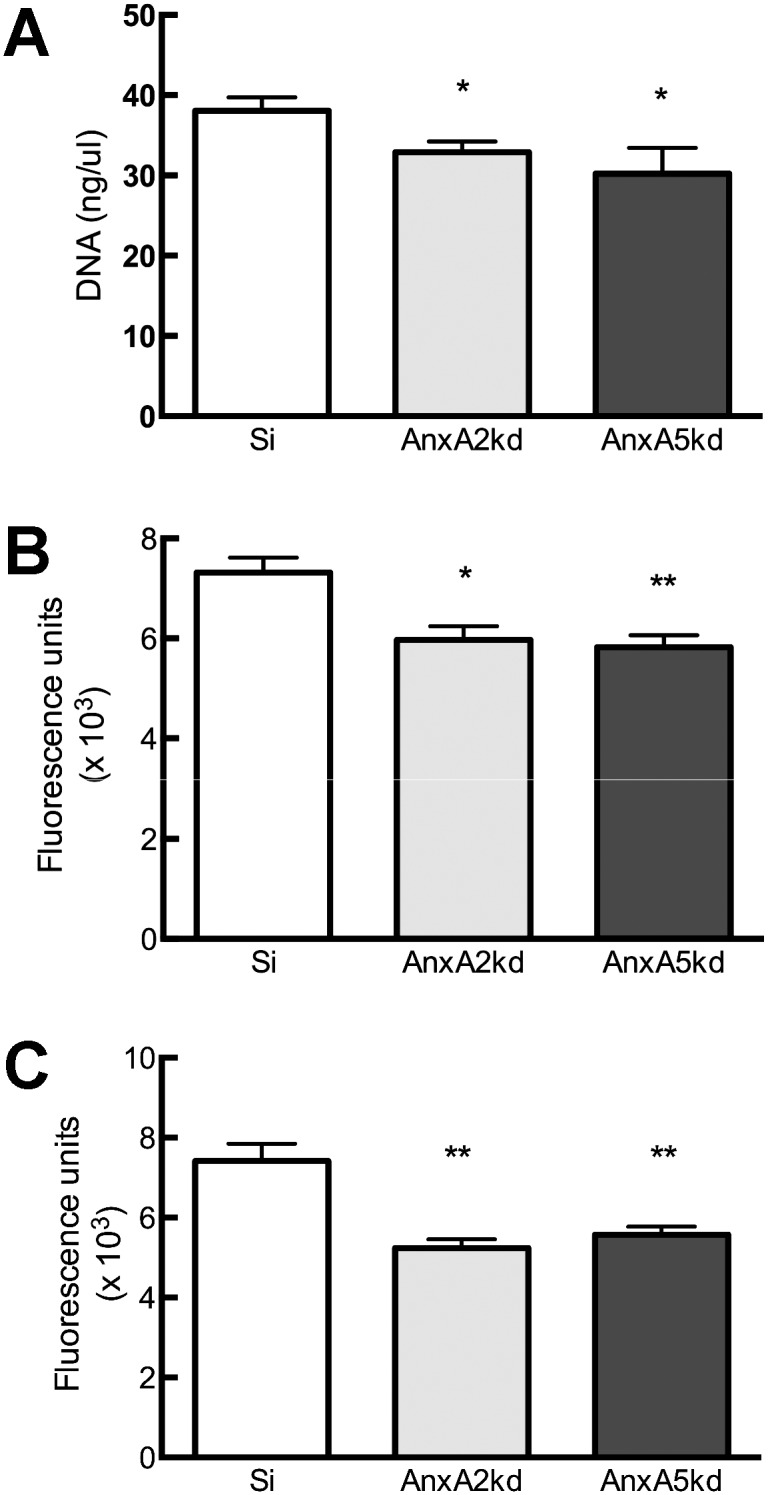
Figure 2. Decreased proliferation in AnxA2kd and AnxA5kd cells.

(A) Quantification of DNA concentration 24 hrs after cell seeding. Bars represent mean DNA concentration (ng/µL sample)±SEM, n = 5–8. (B) Quantification of Calcein-AM fluorescence 24 hrs after cell seeding. Bars represent mean calcein fluorescence units ± SEM, n = 3–8. (C) Quantification of Alamar blue absorbance 48 hrs after cell seeding. Bars represent mean optical density ± SEM, n = 8. *, **represent statistically significant difference from Si, *p<0.05, **p<0.01.
