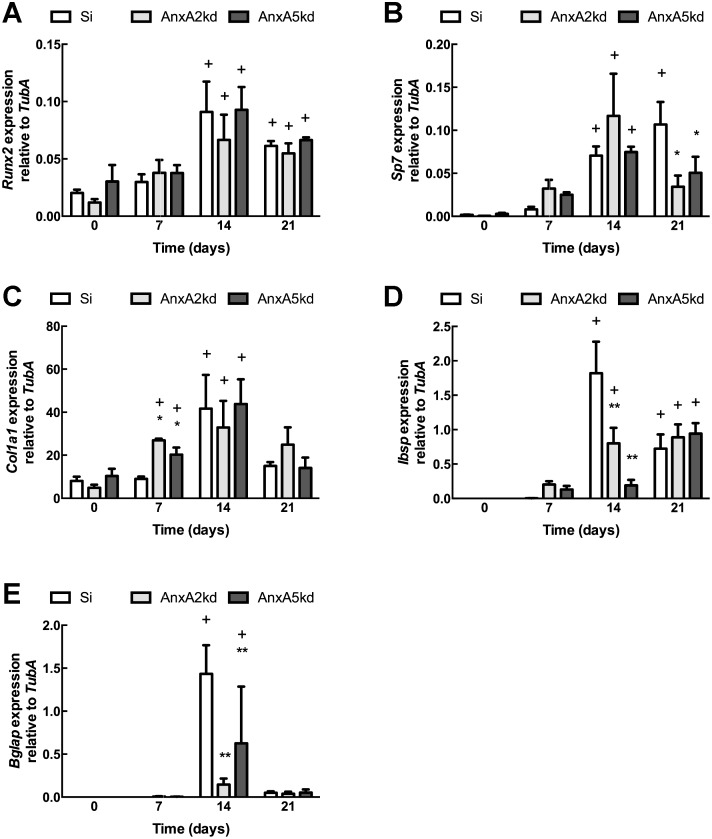
Figure 3. Effects of AnxA2 and AnxA5 knockdown on expression of genes associated with osteogenic differentiation.
qPCR analysis of (A) Runx2, (B) Sp7, (C) Col1a1, (D) Ibsp, and (E) Bglap expression in undifferentiated Si, AnxA2kd and Anx5kd cells (day 0) and in cells cultured in differentiation medium for 7, 14 and 21 days. Each bar represents mean transcript normalized to α-tubulin ± SEM, n = 3. *, **, ***represent statistically significant difference from Si at same time point, *p<0.05, **p<0.01, ***p<0.001; + represents statistically significant difference from same genotype on day 0, p<0.05.

