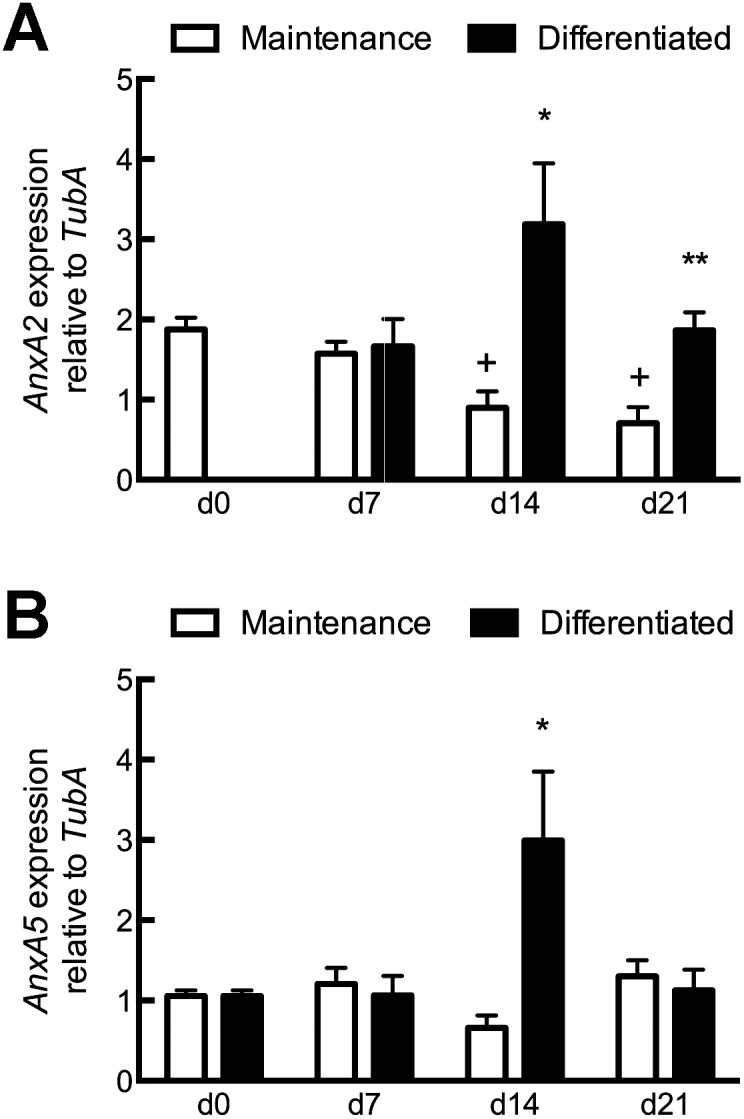
Figure 5. Effects of osteogenic differentiation on expression of AnxA2 and AnxA5.

qPCR analysis of (A) AnxA2 or (B) AnxA5 expression in undifferentiated Si cells at day 0 and in cells cultured in maintenance or osteogenic media 7, 14 and 21 days. Each bar represents mean transcript normalized to α-tubulin ± SEM, n = 3–5. *, **represent statistically significant difference from maintenance control at same time point, *p<0.05, **p<0.01; + represents statistically different from same media composition on day 0, p<0.05.
