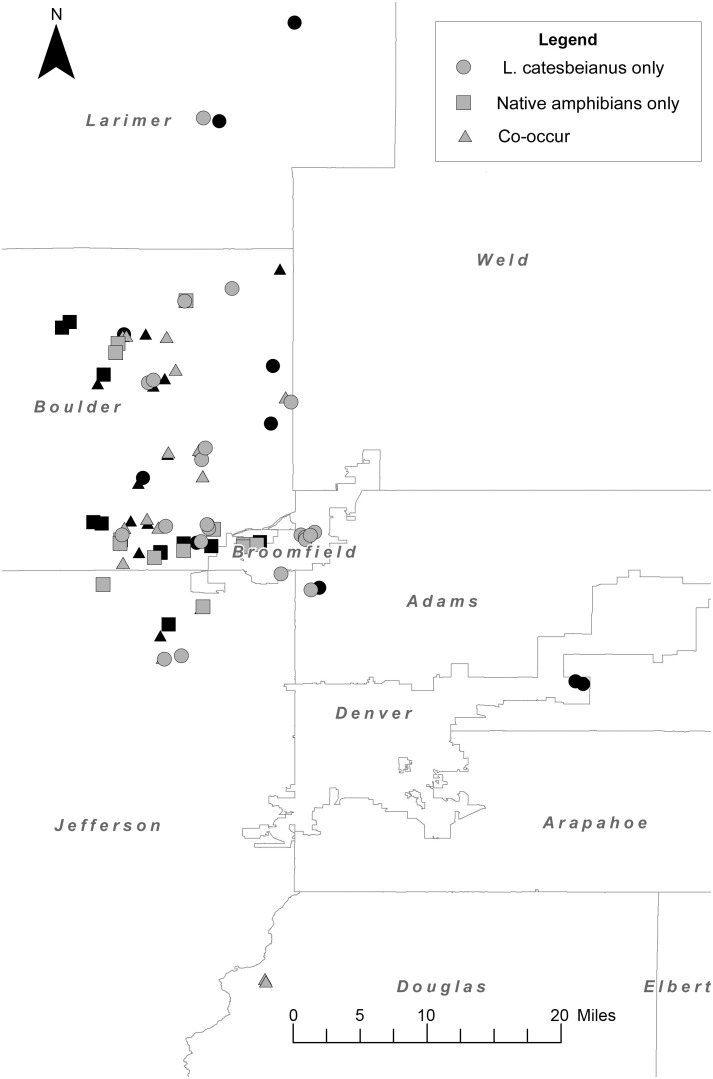
Figure 1. Map of all wetlands included in the Colorado Front Range amphibian survey.
All 99 wetlands at which we sampled for amphibians are included above. Wetlands at which we collected population level Bd data (n = 36) are in black, all other wetlands are in grey (n = 63). Circles (L. catesbeianus only) represent wetlands where we detected only L. catesbeianus individuals, squares represent wetlands where we detected populations of at least one native amphibian species, and triangles represent wetlands where we detected sympatric populations of at least one native amphibian species and L. catesbeianus.

