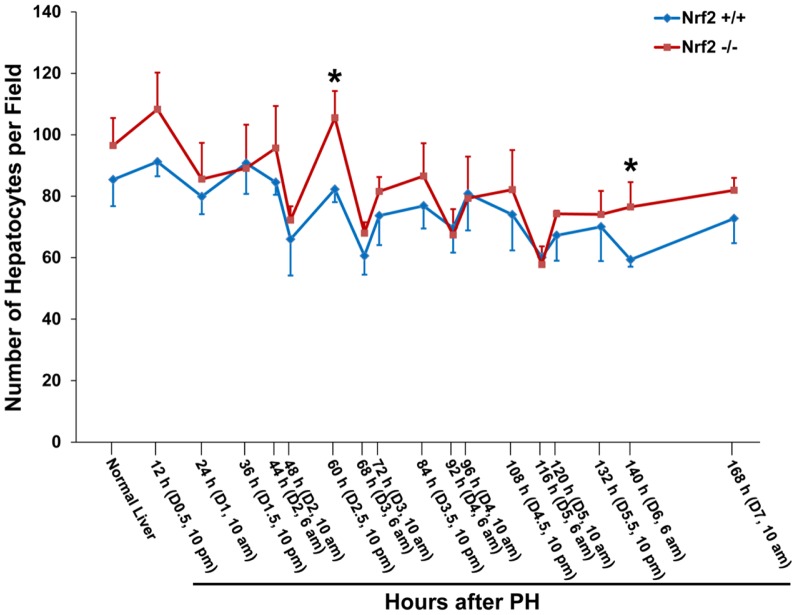
Figure 1. Changes in hepatocyte density after partial hepatectomy (PH) in Nrf2+/+ and Nrf2−/− mice.
Livers were collected from the two genotype groups of mice at the indicated time points post-PH. Liver sections were prepared and subjected to hematoxylin and eosin staining. Hepatocytes were counted in five randomly chosen fields per liver section (400x magnification) with Image-Pro Plus software. The results are shown as the means per field ± SD (n = 3 to 5 mice/time point/genotype; *, p<0.05 between Nrf2+/+ and Nrf2−/− mice).

