
Figure 1.
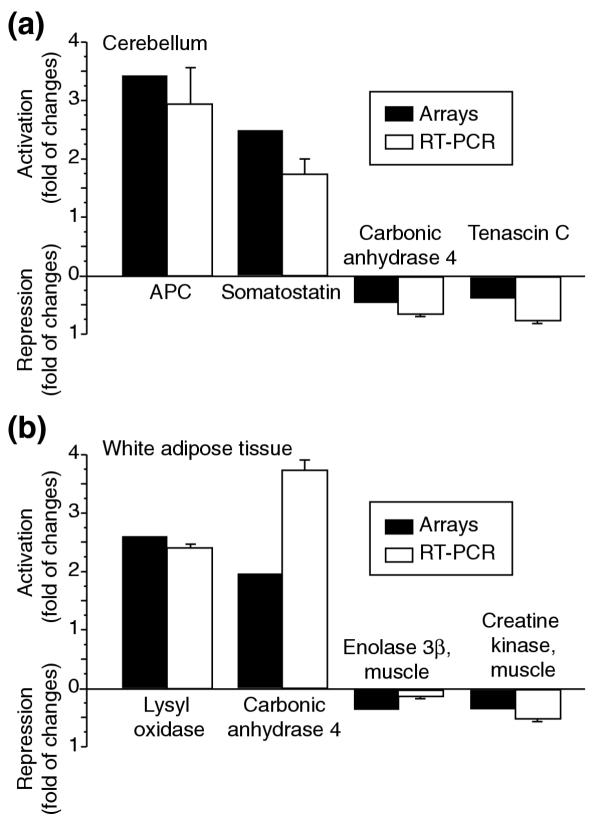
Concordance of gene expression determined by microarrays and RT-PCR. Expression ratios of representative genes in (a) cerebellum and (b) white adipose tissue identified as outliers by microarrays were determined by RT-PCR as described in Materials and methods. The solid bars represent the data from the microarrays and the open bars are from the RT-PCR (mean ± SEM, n = 3).