
Figure 4.
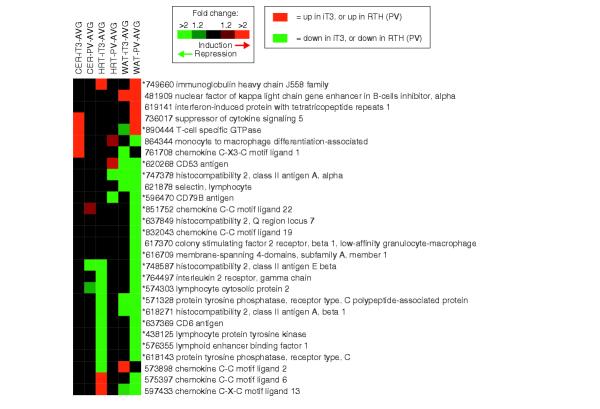
Treeview visualization of iT3- and PV-responsive immunity/lymphocyte-related genes. Higher and lower transcript levels in T3-treated animals (iT3) or RTH mice (PV) are indicated by arrows (as relative to iT3 control or wild-type mice, respectively). IMAGE clone IDs and UniGene names are given; asterisks (*) indicate immune cell-specific genes.