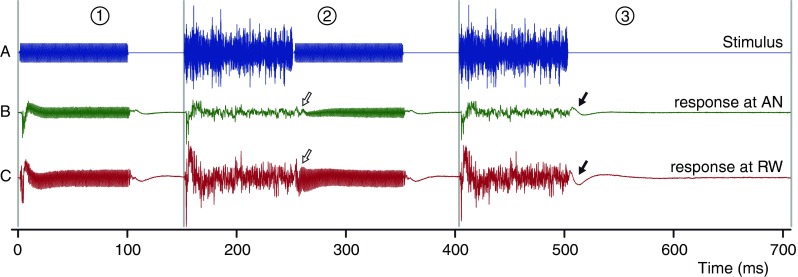
FIG. 1.

An illustration of the paradigm showing three of the six segments of the stimulus (A) with corresponding averaged responses at the AN (B) and RW (C). 1, The probe only; 2, the probe preceded by a masker; and 3, the masker only. The probe is a tone of 1 kHz, and the masker is a broadband noise. The arrows indicate the offset response to the masker. These three segments are followed by three segments (not shown) that are identical but opposite in polarity.
