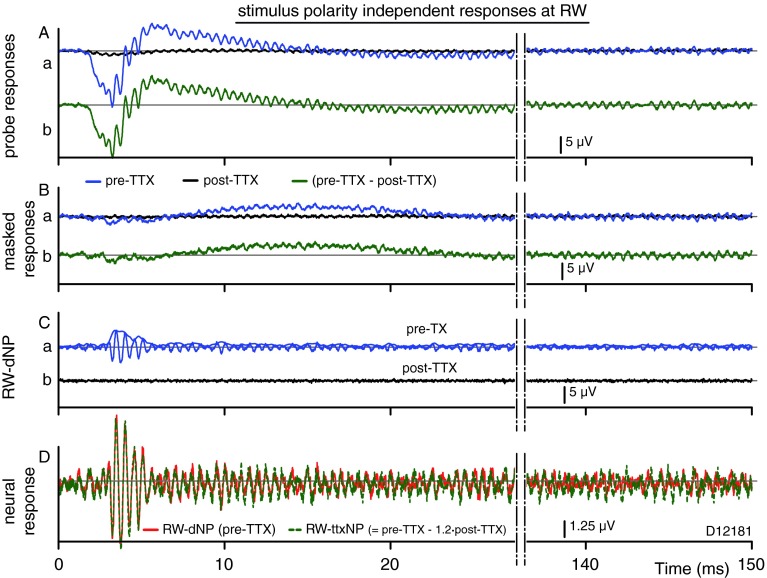
FIG. 15.
Same as Figure 12, but for the stimulus-independent components. Calculated as the half sum of the corresponding pairs in Figure 11, the results represent the CAP and even harmonics, here dominated by the second-harmonic component. A–C Similar to Figure 12, but not compensated for post-TTX reduction in CM. D Overlay of neural contribution estimated with forward masking (red) or TTX (dashed green; note, magnitude ×4 re. other panels). Green dashed line Signal obtained as the CAP-filtered difference of the traces in (A a), pre-TTX, and post-TTX, but with the post-TTX compensated by ×1.2. Red Same as trace in Ca.

