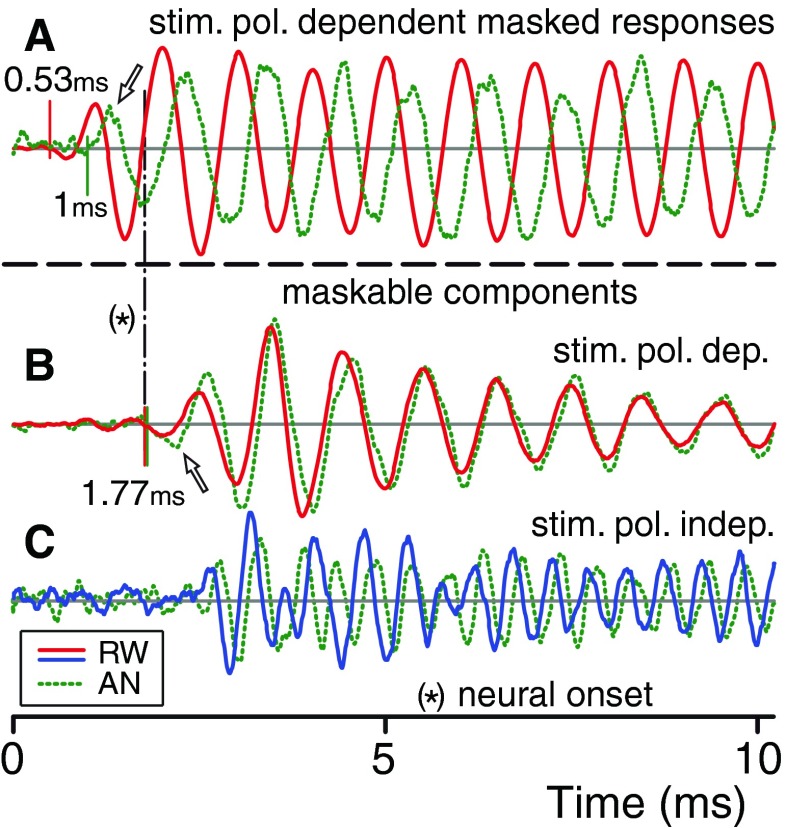
FIG. 4.
Comparison of the onset regions of responses recorded on the AN (green dotted lines) and RW (red and blue solid lines). A The stimulus polarity-dependent masked responses, which at onset reflect CM. B, C Adapted, i.e., neural, components: polarity-dependent (B) and independent (C). Corresponding onset values are indicated and accompanied by vertical lines. The amplitudes are individually and arbitrarily scaled; only the polarity-independent signals (C) have the same scale. The arrows indicate the first half cycle.

