
FIG. 5.
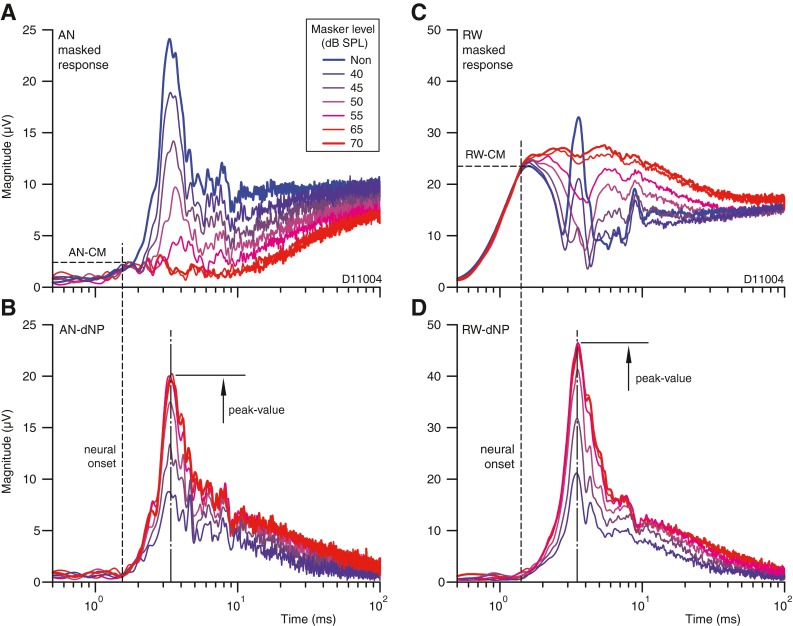
Dependence of the response magnitude and time course on masker level. A, C Masked responses at the AN and RW. The unmasked response is shown with the thick blue line. B, D Decaying auditory neurophonic calculated as the vectorial difference between masked and unmasked responses at a given masker level. The estimated neural onset is indicated by the dashed lines in (A) and (C). The peak magnitudes of the decaying auditory neurophonic are indicated by the arrows. The probe frequency and level are fixed and equal 1 kHz and 55 dB SPL; the masker was a broadband noise (50 Hz–8 kHz). These recordings are from a different experiment (animal) than those of Figures 2, 3, and 4.